Central Manchester, Connecticut (CT) income map, earnings map, and wages data
The median household income in Central Manchester, CT in 2022 was $74,415, which was 18.8% less than the median annual income of $88,429 across the entire state of Connecticut. Compared to the median income of $43,977 in 2000 this represents an increase of 40.9%. The per capita income in 2022 was $41,444, which means an increase of 45.3% compared to 2000 when it was $22,656.
Income statistics for all residents
Median household income in Central Manchester, CT in 2022:| Central Manchester: | $74,415 |
| State: | $88,429 |
Change in median household income between 2000 and 2022:| Central Manchester, Connecticut: | +69.2% |
| State: | +64.0% |
Number of households with income < $10k:| Central Manchester: | 5.2% (30,311) |
| State: | 5.1% (72,746) |
Number of households with income $10k - 20k:| Central Manchester: | 5.8% (34,180) |
| State: | 5.7% (81,643) |
Number of households with income $20k - 30k:| Central Manchester: | 6.6% (38,689) |
| State: | 6.5% (92,844) |
Number of households with income $30k - 40k:| Central Manchester: | 5.9% (34,721) |
| State: | 5.9% (83,934) |
Number of households with income $40k - 50k:| Central Manchester: | 5.9% (34,498) |
| Connecticut: | 5.8% (83,025) |
Number of households with income $50k - 60k:| Central Manchester: | 5.8% (33,827) |
| State: | 5.7% (81,788) |
Number of households with income $60k - 75k:| Central Manchester: | 8.1% (47,396) |
| State: | 8.1% (115,651) |
Number of households with income $75k - 100k:| Central Manchester: | 12.6% (74,022) |
| State: | 12.6% (180,173) |
Number of households with income $100k - 125k:| Central Manchester: | 9.8% (57,625) |
| State: | 9.9% (141,231) |
Number of households with income $125k - 150k:| Central Manchester: | 7.8% (46,019) |
| State: | 7.9% (112,826) |
Number of households with income $150k - 200k:| Central Manchester: | 10.7% (62,951) |
| Connecticut: | 10.8% (154,641) |
Number of households with income > $200k:| Central Manchester: | 16.0% (94,044) |
| State: | 16.3% (233,133) |
Aggregate household income in Central Manchester in 2022: $29,137,776,633
Median family income in Central Manchester in 2022:| Central Manchester: | $96,406 |
| State: | $115,183 |
Median non-family income in Central Manchester in 2022:| Central Manchester: | $53,935 |
| Connecticut: | $50,964 |
Change in median non-family income between 2000 and 2022:| Central Manchester, Connecticut: | +71.5% |
| State: | +65.1% |
Median per capita income in Central Manchester in 2022:| Central Manchester: | $41,445 |
| State: | $51,581 |
Change in median per capita income between 2000 and 2022:| Central Manchester, Connecticut: | +82.9% |
| State: | +79.3% |
Income statistics for White residents
Median household income in Central Manchester, CT in 2022:| Central Manchester: | $76,277 |
| Connecticut: | $96,890 |
Change in median household income between 2000 and 2022:| Central Manchester, Connecticut: | +69.4% |
| State: | +68.5% |
Number of households with income < $10k:| Central Manchester: | 4.2% (16,683) |
| Connecticut: | 4.2% (42,265) |
Number of households with income $10k - 20k:| Central Manchester: | 4.9% (19,181) |
| Connecticut: | 4.8% (48,323) |
Number of households with income $20k - 30k:| Central Manchester: | 5.8% (22,812) |
| State: | 5.7% (57,716) |
Number of households with income $30k - 40k:| Central Manchester: | 5.4% (21,115) |
| Connecticut: | 5.3% (53,827) |
Number of households with income $40k - 50k:| Central Manchester: | 5.3% (21,028) |
| State: | 5.3% (53,301) |
Number of households with income $50k - 60k:| Central Manchester: | 5.6% (21,884) |
| State: | 5.5% (55,690) |
Number of households with income $60k - 75k:| Central Manchester: | 7.9% (31,273) |
| State: | 8.0% (80,329) |
Number of households with income $75k - 100k:| Central Manchester: | 12.7% (50,111) |
| Connecticut: | 12.7% (128,070) |
Number of households with income $100k - 125k:| Central Manchester: | 10.0% (39,349) |
| Connecticut: | 10.0% (101,210) |
Number of households with income $125k - 150k:| Central Manchester: | 8.0% (31,590) |
| Connecticut: | 8.0% (81,250) |
Number of households with income $150k - 200k:| Central Manchester: | 11.8% (46,451) |
| Connecticut: | 11.8% (119,527) |
Number of households with income > $200k:| Central Manchester: | 18.4% (72,716) |
| State: | 18.6% (187,875) |
Aggregate household income in Central Manchester in 2022: $19,787,333,698
Median family income in Central Manchester in 2022:| Central Manchester: | $102,679 |
| State: | $128,955 |
Number of families with income < $10k:| Central Manchester: | 4.8% (189) |
| State: | 1.9% (11,537) |
Number of families with income $10k - 20k:| Central Manchester: | 3.4% (134) |
| State: | 1.8% (11,289) |
Number of families with income $20k - 30k:| Central Manchester: | 6.1% (239) |
| State: | 3.0% (18,506) |
Number of families with income $30k - 40k:| Central Manchester: | 6.9% (272) |
| State: | 2.9% (18,160) |
Number of families with income $40k - 50k:| Central Manchester: | 7.8% (307) |
| State: | 3.9% (24,550) |
Number of families with income $50k - 60k:| Central Manchester: | 7.5% (294) |
| Connecticut: | 4.3% (26,723) |
Number of families with income $60k - 75k:| Central Manchester: | 11.5% (452) |
| Connecticut: | 7.1% (44,075) |
Number of families with income $75k - 100k:| Central Manchester: | 17.1% (671) |
| State: | 12.5% (77,679) |
Number of families with income $100k - 125k:| Central Manchester: | 12.5% (489) |
| State: | 11.1% (69,086) |
Number of families with income $125k - 150k:| Central Manchester: | 6.6% (258) |
| State: | 9.6% (59,616) |
Number of families with income $150k - 200k:| Central Manchester: | 9.4% (369) |
| State: | 15.7% (97,890) |
Number of families with income > $200k:| Central Manchester: | 6.4% (253) |
| State: | 26.3% (163,417) |
Median non-family income in Central Manchester in 2022:| Central Manchester: | $54,862 |
| State: | $54,067 |
Change in median non-family income between 2000 and 2022:| Central Manchester, Connecticut: | +73.7% |
| State: | +68.7% |
Median per capita income in Central Manchester in 2022:| Central Manchester: | $46,760 |
| State: | $59,916 |
Change in median per capita income between 2000 and 2022:| Central Manchester, Connecticut: | +92.1% |
| Connecticut: | +90.2% |
Income statistics for Black or African American residents
Median household income in Central Manchester, CT in 2022:| Central Manchester: | $52,966 |
| State: | $61,803 |
Change in median household income between 2000 and 2022:| Central Manchester, Connecticut: | +60.9% |
| State: | +76.1% |
Number of households with income < $10k:| Central Manchester: | 6.8% (8,903) |
| Connecticut: | 6.8% (9,494) |
Number of households with income $10k - 20k:| Central Manchester: | 7.9% (10,318) |
| State: | 7.9% (11,003) |
Number of households with income $20k - 30k:| Central Manchester: | 10.8% (14,107) |
| Connecticut: | 10.8% (15,045) |
Number of households with income $30k - 40k:| Central Manchester: | 8.2% (10,785) |
| State: | 8.2% (11,501) |
Number of households with income $40k - 50k:| Central Manchester: | 7.4% (9,768) |
| Connecticut: | 7.4% (10,416) |
Number of households with income $50k - 60k:| Central Manchester: | 7.5% (9,878) |
| Connecticut: | 7.5% (10,534) |
Number of households with income $60k - 75k:| Central Manchester: | 8.0% (10,543) |
| State: | 8.0% (11,244) |
Number of households with income $75k - 100k:| Central Manchester: | 9.6% (12,537) |
| State: | 9.6% (13,370) |
Number of households with income $100k - 125k:| Central Manchester: | 10.2% (13,357) |
| State: | 10.2% (14,244) |
Number of households with income $125k - 150k:| Central Manchester: | 8.0% (10,545) |
| State: | 8.0% (11,246) |
Number of households with income $150k - 200k:| Central Manchester: | 7.7% (10,059) |
| State: | 7.7% (10,727) |
Number of households with income > $200k:| Central Manchester: | 7.9% (10,395) |
| State: | 7.9% (11,086) |
Aggregate household income in Central Manchester in 2022: $201,129,748
Median family income in Central Manchester in 2022:| Central Manchester: | $71,776 |
| Connecticut: | $87,228 |
Number of families with income < $10k:| Central Manchester: | 6.2% (37) |
| Connecticut: | 3.8% (3,184) |
Number of families with income $10k - 20k:| Central Manchester: | 2.4% (14) |
| Connecticut: | 4.8% (4,026) |
Number of families with income $20k - 30k:| Central Manchester: | 7.4% (44) |
| State: | 6.0% (5,015) |
Number of families with income $30k - 40k:| Central Manchester: | 9.8% (58) |
| Connecticut: | 7.7% (6,445) |
Number of families with income $40k - 50k:| Central Manchester: | 12.0% (71) |
| State: | 6.6% (5,531) |
Number of families with income $50k - 60k:| Central Manchester: | 4.2% (25) |
| Connecticut: | 5.4% (4,480) |
Number of families with income $60k - 75k:| Central Manchester: | 9.8% (58) |
| State: | 8.2% (6,861) |
Number of families with income $75k - 100k:| Central Manchester: | 13.6% (81) |
| State: | 12.7% (10,598) |
Number of families with income $100k - 125k:| Central Manchester: | 6.3% (38) |
| State: | 11.4% (9,482) |
Number of families with income $150k - 200k:| Central Manchester: | 8.2% (49) |
| Connecticut: | 11.4% (9,497) |
Number of families with income > $200k:| Central Manchester: | 19.9% (118) |
| State: | 10.8% (9,057) |
Median non-family income in Central Manchester in 2022:| Central Manchester: | $56,412 |
| State: | $38,608 |
Change in median non-family income between 2000 and 2022:| Central Manchester, Connecticut: | +77.0% |
| State: | +77.0% |
Median per capita income in Central Manchester in 2022:| Central Manchester: | $34,403 |
| State: | $36,289 |
Change in median per capita income between 2000 and 2022:| Central Manchester, Connecticut: | +115.2% |
| State: | +117.5% |
Income statistics for Asian residents
Median household income in Central Manchester, CT in 2022:| Central Manchester: | $83,319 |
| State: | $110,568 |
Change in median household income between 2000 and 2022:| Central Manchester, Connecticut: | +110.1% |
| Connecticut: | +79.5% |
Number of households with income < $10k:| Central Manchester: | 7.1% (2,734) |
| State: | 7.1% (4,245) |
Number of households with income $10k - 20k:| Central Manchester: | 3.5% (1,344) |
| State: | 3.5% (2,087) |
Number of households with income $20k - 30k:| Central Manchester: | 4.1% (1,587) |
| Connecticut: | 4.1% (2,464) |
Number of households with income $30k - 40k:| Central Manchester: | 4.1% (1,596) |
| Connecticut: | 4.1% (2,478) |
Number of households with income $40k - 50k:| Central Manchester: | 3.3% (1,277) |
| Connecticut: | 3.3% (1,983) |
Number of households with income $50k - 60k:| Central Manchester: | 3.9% (1,499) |
| Connecticut: | 3.9% (2,328) |
Number of households with income $60k - 75k:| Central Manchester: | 7.0% (2,723) |
| State: | 7.0% (4,228) |
Number of households with income $75k - 100k:| Central Manchester: | 11.5% (4,450) |
| State: | 11.5% (6,911) |
Number of households with income $100k - 125k:| Central Manchester: | 10.2% (3,945) |
| State: | 10.2% (6,127) |
Number of households with income $125k - 150k:| Central Manchester: | 8.5% (3,271) |
| State: | 8.5% (5,079) |
Number of households with income $150k - 200k:| Central Manchester: | 12.4% (4,787) |
| State: | 12.4% (7,434) |
Number of households with income > $200k:| Central Manchester: | 24.4% (9,441) |
| State: | 24.4% (14,661) |
Aggregate household income in Central Manchester in 2022: $57,578,387
Median family income in Central Manchester in 2022:| Central Manchester: | $80,959 |
| State: | $134,548 |
Number of families with income < $10k:| Central Manchester: | 20.8% (59) |
| Connecticut: | 4.3% (1,875) |
Number of families with income $10k - 20k:| Central Manchester: | 2.2% (6) |
| Connecticut: | 1.6% (700) |
Number of families with income $20k - 30k:| Central Manchester: | 15.0% (42) |
| State: | 3.8% (1,682) |
Number of families with income $30k - 40k:| Central Manchester: | 10.5% (30) |
| State: | 3.8% (1,652) |
Number of families with income $50k - 60k:| Central Manchester: | 1.9% (5) |
| State: | 3.7% (1,635) |
Number of families with income $60k - 75k:| Central Manchester: | 16.3% (46) |
| Connecticut: | 6.0% (2,651) |
Number of families with income $75k - 100k:| Central Manchester: | 14.5% (41) |
| State: | 11.0% (4,844) |
Number of families with income $100k - 125k:| Central Manchester: | 6.3% (18) |
| State: | 10.5% (4,621) |
Number of families with income $125k - 150k:| Central Manchester: | 12.4% (35) |
| State: | 8.2% (3,588) |
Median non-family income in Central Manchester in 2022:| Central Manchester: | $119,322 |
| Connecticut: | $63,785 |
Change in median non-family income between 2000 and 2022:| Central Manchester, Connecticut: | +148.6% |
| State: | +77.9% |
Median per capita income in Central Manchester in 2022:| Central Manchester: | $30,882 |
| Connecticut: | $55,295 |
Change in median per capita income between 2000 and 2022:| Central Manchester, Connecticut: | +103.6% |
| State: | +97.8% |
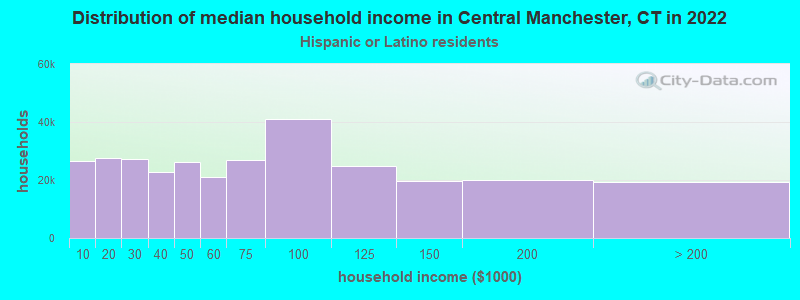
Income statistics for Hispanic or Latino residents
Median household income in Central Manchester, CT in 2022:| Central Manchester: | $76,868 |
| State: | $60,275 |
Change in median household income between 2000 and 2022:| Central Manchester, Connecticut: | +67.8% |
| State: | +87.9% |
Number of households with income < $10k:| Central Manchester: | 8.7% (26,543) |
| State: | 8.7% (18,584) |
Number of households with income $10k - 20k:| Central Manchester: | 9.1% (27,472) |
| State: | 9.1% (19,235) |
Number of households with income $20k - 30k:| Central Manchester: | 8.9% (27,121) |
| State: | 8.9% (18,989) |
Number of households with income $30k - 40k:| Central Manchester: | 7.5% (22,805) |
| State: | 7.5% (15,967) |
Number of households with income $40k - 50k:| Central Manchester: | 8.7% (26,374) |
| Connecticut: | 8.7% (18,466) |
Number of households with income $50k - 60k:| Central Manchester: | 6.9% (21,004) |
| State: | 6.9% (14,706) |
Number of households with income $60k - 75k:| Central Manchester: | 8.9% (26,977) |
| Connecticut: | 8.9% (18,888) |
Number of households with income $75k - 100k:| Central Manchester: | 13.5% (40,946) |
| State: | 13.5% (28,669) |
Number of households with income $100k - 125k:| Central Manchester: | 8.2% (24,900) |
| Connecticut: | 8.2% (17,434) |
Number of households with income $125k - 150k:| Central Manchester: | 6.5% (19,641) |
| State: | 6.5% (13,752) |
Number of households with income $150k - 200k:| Central Manchester: | 6.6% (20,158) |
| State: | 6.6% (14,114) |
Number of households with income > $200k:| Central Manchester: | 6.4% (19,467) |
| State: | 6.4% (13,630) |
Aggregate household income in Central Manchester in 2022: $235,555,747
Median family income in Central Manchester in 2022:| Central Manchester: | $80,454 |
| State: | $68,336 |
Number of families with income < $10k:| Central Manchester: | 7.2% (91) |
| State: | 5.2% (7,456) |
Number of families with income $10k - 20k:| Central Manchester: | 8.2% (105) |
| State: | 6.0% (8,616) |
Number of families with income $20k - 30k:| Central Manchester: | 14.1% (180) |
| Connecticut: | 8.9% (12,680) |
Number of families with income $30k - 40k:| Central Manchester: | 12.3% (157) |
| State: | 8.5% (12,090) |
Number of families with income $40k - 50k:| Central Manchester: | 11.6% (148) |
| State: | 8.8% (12,624) |
Number of families with income $50k - 60k:| Central Manchester: | 10.4% (133) |
| State: | 8.4% (11,924) |
Number of families with income $60k - 75k:| Central Manchester: | 9.3% (119) |
| Connecticut: | 8.9% (12,677) |
Number of families with income $75k - 100k:| Central Manchester: | 13.5% (172) |
| State: | 14.3% (20,457) |
Number of families with income $100k - 125k:| Central Manchester: | 6.0% (77) |
| State: | 8.2% (11,720) |
Number of families with income $125k - 150k:| Central Manchester: | 3.6% (46) |
| State: | 8.2% (11,729) |
Number of families with income $150k - 200k:| Central Manchester: | 2.7% (35) |
| State: | 7.1% (10,096) |
Number of families with income > $200k:| Central Manchester: | 1.0% (13) |
| State: | 7.4% (10,622) |
Median non-family income in Central Manchester in 2022:| Central Manchester: | $29,705 |
| State: | $36,714 |
Change in median non-family income between 2000 and 2022:| Central Manchester, Connecticut: | +73.9% |
| Connecticut: | +90.0% |
Median per capita income in Central Manchester in 2022:| Central Manchester: | $27,051 |
| Connecticut: | $28,507 |
Change in median per capita income between 2000 and 2022:| Central Manchester, Connecticut: | +80.3% |
| State: | +117.2% |
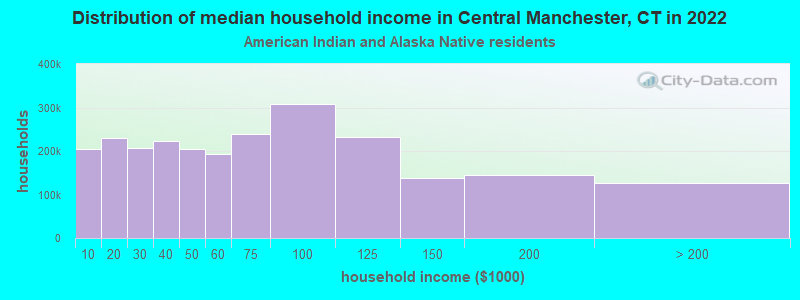
Income statistics for American Indian and Alaska Native residents
Median household income in Central Manchester, CT in 2022:| Central Manchester: | $81,545 |
| State: | $41,848 |
Change in median household income between 2000 and 2022:| Central Manchester, Connecticut: | +12.9% |
| State: | +12.9% |
Number of households with income < $10k:| Central Manchester: | 8.4% (205,447) |
| State: | 10.2% (340) |
Number of households with income $10k - 20k:| Central Manchester: | 9.4% (229,274) |
| State: | 8.5% (283) |
Number of households with income $20k - 30k:| Central Manchester: | 8.5% (207,380) |
| State: | 9.4% (314) |
Number of households with income $30k - 40k:| Central Manchester: | 9.1% (222,183) |
| State: | 10.1% (337) |
Number of households with income $40k - 50k:| Central Manchester: | 8.3% (203,802) |
| Connecticut: | 13.4% (447) |
Number of households with income $50k - 60k:| Central Manchester: | 7.8% (192,168) |
| State: | 3.1% (104) |
Number of households with income $60k - 75k:| Central Manchester: | 9.8% (239,528) |
| Connecticut: | 5.6% (188) |
Number of households with income $75k - 100k:| Central Manchester: | 12.6% (309,193) |
| State: | 13.4% (447) |
Number of households with income $100k - 125k:| Central Manchester: | 9.4% (231,215) |
| State: | 9.5% (317) |
Number of households with income $125k - 150k:| Central Manchester: | 5.6% (138,427) |
| State: | 3.9% (131) |
Number of households with income $150k - 200k:| Central Manchester: | 6.0% (145,929) |
| State: | 6.3% (212) |
Number of households with income > $200k:| Central Manchester: | 5.2% (126,309) |
| Connecticut: | 6.8% (228) |
Aggregate household income in Central Manchester in 2022: $2,749,351
Median family income in Central Manchester in 2022:| Central Manchester: | $97,700 |
| State: | $57,217 |
Number of families with income $50k - 60k:| Central Manchester: | 25.1% (10) |
| State: | 2.3% (46) |
Number of families with income $60k - 75k:| Central Manchester: | 18.9% (7) |
| Connecticut: | 6.9% (139) |
Number of families with income $75k - 100k:| Central Manchester: | 55.9% (21) |
| State: | 17.4% (349) |
Median non-family income in Central Manchester in 2022:| Central Manchester: | $169,219 |
| State: | $40,310 |
Change in median non-family income between 2000 and 2022:| Central Manchester, Connecticut: | +125.1% |
| State: | +125.1% |
Median per capita income in Central Manchester in 2022:| Central Manchester: | $39,266 |
| Connecticut: | $25,355 |
Change in median per capita income between 2000 and 2022:| Central Manchester, Connecticut: | +45.9% |
| State: | +39.4% |
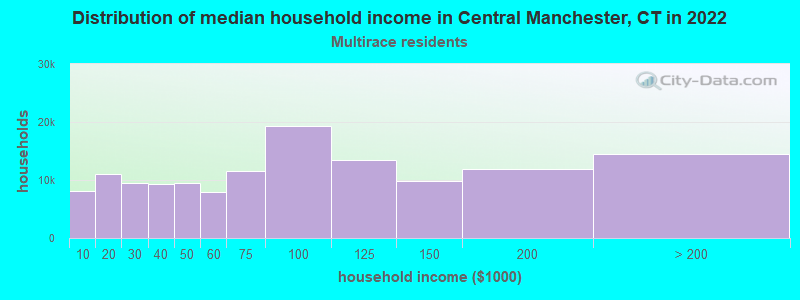
Income statistics for Multirace residents
Median household income in Central Manchester, CT in 2022:| Central Manchester: | $86,766 |
| State: | $77,277 |
Change in median household income between 2000 and 2022:| Central Manchester, Connecticut: | +119.4% |
| State: | +113.6% |
Number of households with income < $10k:| Central Manchester: | 6.0% (8,148) |
| Connecticut: | 6.0% (7,457) |
Number of households with income $10k - 20k:| Central Manchester: | 8.1% (11,079) |
| State: | 8.1% (10,139) |
Number of households with income $20k - 30k:| Central Manchester: | 7.0% (9,508) |
| State: | 7.0% (8,702) |
Number of households with income $30k - 40k:| Central Manchester: | 6.9% (9,338) |
| State: | 6.9% (8,546) |
Number of households with income $40k - 50k:| Central Manchester: | 7.0% (9,519) |
| State: | 7.0% (8,712) |
Number of households with income $50k - 60k:| Central Manchester: | 5.9% (8,010) |
| State: | 5.9% (7,331) |
Number of households with income $60k - 75k:| Central Manchester: | 8.5% (11,619) |
| Connecticut: | 8.5% (10,634) |
Number of households with income $75k - 100k:| Central Manchester: | 14.1% (19,231) |
| Connecticut: | 14.1% (17,600) |
Number of households with income $100k - 125k:| Central Manchester: | 9.9% (13,530) |
| Connecticut: | 9.9% (12,383) |
Number of households with income $125k - 150k:| Central Manchester: | 7.2% (9,748) |
| State: | 7.2% (8,921) |
Number of households with income $150k - 200k:| Central Manchester: | 8.8% (11,934) |
| Connecticut: | 8.8% (10,922) |
Number of households with income > $200k:| Central Manchester: | 10.6% (14,474) |
| State: | 10.6% (13,247) |
Aggregate household income in Central Manchester in 2022: $104,023,430
Median family income in Central Manchester in 2022:| Central Manchester: | $85,454 |
| State: | $84,255 |
Number of families with income < $10k:| Central Manchester: | 6.4% (25) |
| Connecticut: | 3.6% (3,027) |
Number of families with income $10k - 20k:| Central Manchester: | 8.7% (34) |
| State: | 4.8% (4,079) |
Number of families with income $30k - 40k:| Central Manchester: | 25.2% (97) |
| Connecticut: | 6.8% (5,759) |
Number of families with income $40k - 50k:| Central Manchester: | 5.5% (21) |
| State: | 6.9% (5,792) |
Number of families with income $50k - 60k:| Central Manchester: | 5.9% (23) |
| State: | 7.6% (6,420) |
Number of families with income $60k - 75k:| Central Manchester: | 34.5% (133) |
| State: | 7.8% (6,550) |
Number of families with income $75k - 100k:| Central Manchester: | 13.7% (53) |
| State: | 14.5% (12,236) |
Median non-family income in Central Manchester in 2022:| Central Manchester: | $17,914 |
| State: | $44,462 |
Change in median non-family income between 2000 and 2022:| Central Manchester, Connecticut: | +81.0% |
| State: | +97.6% |
Median per capita income in Central Manchester in 2022:| Central Manchester: | $20,328 |
| Connecticut: | $32,794 |
Change in median per capita income between 2000 and 2022:| Central Manchester, Connecticut: | +95.5% |
| State: | +117.2% |
Income statistics for other residents
Number of households with income < $10k:| Central Manchester: | 9.0% (64) |
| State: | 9.0% (8,596) |
Number of households with income $10k - 20k:| Central Manchester: | 10.3% (73) |
| State: | 10.2% (9,773) |
Number of households with income $20k - 30k:| Central Manchester: | 9.2% (65) |
| State: | 9.1% (8,691) |
Number of households with income $30k - 40k:| Central Manchester: | 7.7% (55) |
| State: | 7.8% (7,447) |
Number of households with income $40k - 50k:| Central Manchester: | 8.2% (58) |
| State: | 8.2% (7,860) |
Number of households with income $50k - 60k:| Central Manchester: | 6.1% (43) |
| Connecticut: | 6.0% (5,757) |
Number of households with income $60k - 75k:| Central Manchester: | 9.3% (66) |
| Connecticut: | 9.3% (8,942) |
Number of households with income $75k - 100k:| Central Manchester: | 14.2% (101) |
| State: | 14.3% (13,700) |
Number of households with income $100k - 125k:| Central Manchester: | 7.2% (51) |
| Connecticut: | 7.2% (6,906) |
Number of households with income $125k - 150k:| Central Manchester: | 6.5% (46) |
| State: | 6.5% (6,215) |
Number of households with income $150k - 200k:| Central Manchester: | 6.1% (43) |
| State: | 6.1% (5,865) |
Number of households with income > $200k:| Central Manchester: | 6.3% (45) |
| State: | 6.3% (6,065) |
Aggregate household income in Central Manchester in 2022: $99,375,935
Median family income in Central Manchester in 2022:| Central Manchester: | $74,717 |
| State: | $67,610 |
Number of families with income < $10k:| Central Manchester: | 3.2% (14) |
| State: | 5.0% (3,311) |
Number of families with income $10k - 20k:| Central Manchester: | 9.1% (41) |
| Connecticut: | 7.5% (4,961) |
Number of families with income $20k - 30k:| Central Manchester: | 9.6% (44) |
| State: | 8.7% (5,752) |
Number of families with income $30k - 40k:| Central Manchester: | 10.1% (46) |
| State: | 9.1% (5,996) |
Number of families with income $40k - 50k:| Central Manchester: | 12.9% (58) |
| State: | 9.1% (6,039) |
Number of families with income $50k - 60k:| Central Manchester: | 3.5% (16) |
| State: | 5.9% (3,868) |
Number of families with income $60k - 75k:| Central Manchester: | 23.0% (104) |
| State: | 9.4% (6,232) |
Number of families with income $75k - 100k:| Central Manchester: | 11.8% (53) |
| State: | 15.7% (10,362) |
Number of families with income $100k - 125k:| Central Manchester: | 16.7% (76) |
| State: | 6.8% (4,502) |
Median non-family income in Central Manchester in 2022:| Central Manchester: | $34,432 |
| Connecticut: | $34,285 |
Change in median non-family income between 2000 and 2022:| Central Manchester, Connecticut: | +83.6% |
| State: | +83.6% |
Median per capita income in Central Manchester in 2022:| Central Manchester: | $31,498 |
| State: | $29,353 |