Housing density: 4,138 houses/condos per square mile
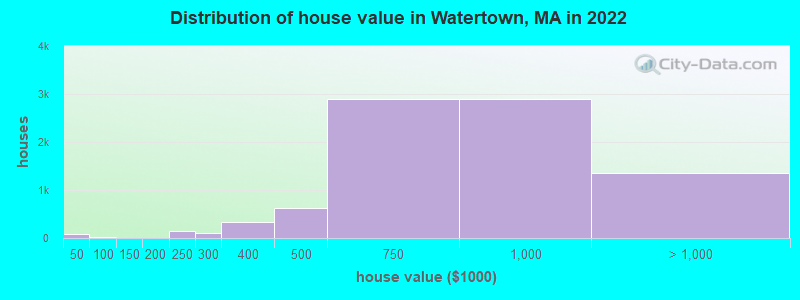
Median price asked for vacant for-sale houses and condos in 2022: $1,076,930.
Median contract rent in 2022: over $2,000 (lower quartile is $1,571, upper quartile is over $2,000)
Median rent asked for vacant for-rent units in 2022: $3,615
Median gross rent in Watertown, MA in 2022: over $2,000
Housing units in Watertown with a mortgage: 5,311 (776 second mortgage, 3 home equity loan, 766 both second mortgage and home equity loan) Houses without a mortgage: 241
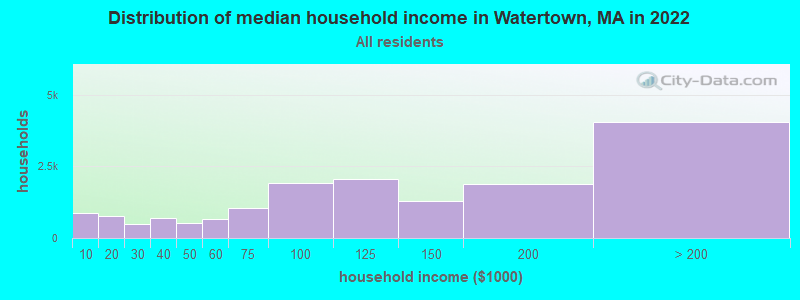
Median household income for houses/condos with a mortgage: $172,059
Median household income for apartments without a mortgage: $106,220
3,902 married couples with children.
854 single-parent households (109 men, 745 women).
67.4% of residents of Watertown speak English at home.
5.0% of residents speak Spanish at home (67% speak English very well, 23% speak English well, 8% speak English not well, 3% don't speak English at all).
18.5% of residents speak other Indo-European language at home (70% speak English very well, 16% speak English well, 7% speak English not well, 7% don't speak English at all).
5.9% of residents speak Asian or Pacific Island language at home (68% speak English very well, 25% speak English well, 6% speak English not well, 1% don't speak English at all).
4.0% of residents speak other language at home (47% speak English very well, 22% speak English well, 31% speak English not well).
Foreign born population: 9,211 (26.3%)
(53.5% of them are naturalized citizens)
Year of entry for the foreign-born population in Watertown, Massachusetts
3,6792010 or later
1,9102000 to 2009
1,4971990 to 1999
1,4521980 to 1989
1,1061970 to 1979
1,632Before 1970
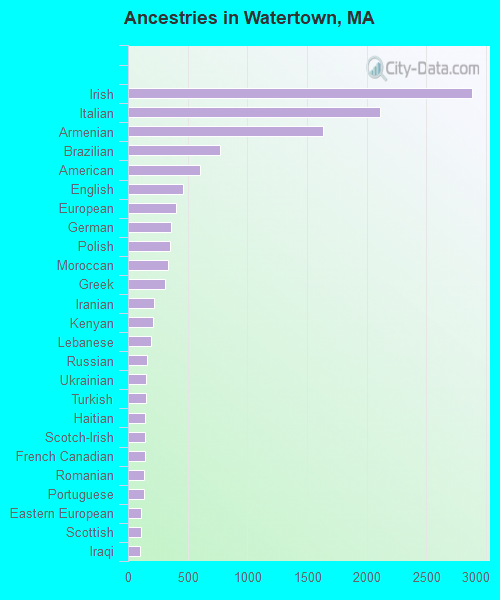
First ancestries reported:
Irish: 2,881 (15.3%)
Italian: 2,114 (11.2%)
Armenian: 1,634 (8.7%)
Brazilian: 769 (4.1%)
American: 605 (3.2%)
English: 457 (2.4%)
European: 405 (2.2%)
German: 357 (1.9%)
Polish: 356 (1.9%)
Moroccan: 336 (1.8%)
Greek: 314 (1.7%)
Iranian: 216 (1.1%)
Kenyan: 211 (1.1%)
Lebanese: 192 (1.0%)
Russian: 157 (0.8%)
Ukrainian: 150 (0.8%)
Turkish: 148 (0.8%)
Haitian: 143 (0.8%)
Scotch-Irish: 142 (0.8%)
French Canadian: 141 (0.8%)
Romanian: 134 (0.7%)
Portuguese: 130 (0.7%)
Eastern European: 112 (0.6%)
Scottish: 106 (0.6%)
Iraqi: 100 (0.5%)
Canadian: 68 (0.4%)
African: 67 (0.4%)
Albanian: 56 (0.3%)
Yugoslavian: 55 (0.3%)
Ethiopian: 49 (0.3%)
British: 48 (0.3%)
French: 47 (0.3%)
Swedish: 45 (0.2%)
Swiss: 43 (0.2%)
Northern European: 41 (0.2%)
West Indian: 35 (0.2%)
Latvian: 32 (0.2%)
Arab: 31 (0.2%)
Israeli: 27 (0.1%)
Australian: 26 (0.1%)
Ugandan: 24 (0.1%)
Serbian: 23 (0.1%)
German Russian: 21 (0.1%)
Dutch: 21 (0.1%)
Welsh: 21 (0.1%)
Austrian: 13 (0.07%)
Cape Verdean: 12 (0.06%)
Finnish: 11 (0.06%)
Jamaican: 9 (0.05%)
New Zealander: 7 (0.04%)
Scandinavian: 6 (0.03%)
Croatian: 1 (0.01%)
Most common places of birth for foreign-born residents (%):
India
Watertown:
12.6% (1,159)
Massachusetts:
6.8% (82,934)
Brazil
Watertown:
9.9% (914)
Massachusetts:
7.6% (92,959)
Armenia
Watertown:
5.7% (526)
Massachusetts:
0.2% (2,307)
China, excluding Hong Kong and Taiwan
Watertown:
4.5% (414)
Massachusetts:
8.4% (103,233)
Italy
Watertown:
3.8% (354)
Massachusetts:
1.4% (16,886)
Lebanon
Watertown:
3.7% (344)
Massachusetts:
0.6% (7,064)
Morocco
Watertown:
3.5% (323)
Massachusetts:
0.7% (8,562)
Turkey
Watertown:
3.3% (308)
Massachusetts:
0.4% (5,208)
Guatemala
Watertown:
2.7% (247)
Massachusetts:
2.7% (32,733)
Korea
Watertown:
2.4% (218)
Massachusetts:
1.4% (17,613)
Haiti
Watertown:
2.3% (214)
Massachusetts:
4.9% (60,432)
Canada
Watertown:
1.9% (179)
Massachusetts:
2.3% (28,158)
Taiwan
Watertown:
1.8% (168)
Massachusetts:
0.7% (8,270)
Kenya
Watertown:
1.8% (167)
Massachusetts:
0.7% (8,746)
Syria
Watertown:
1.8% (162)
Massachusetts:
0.2% (2,918)
Germany
Watertown:
1.8% (162)
Massachusetts:
1.0% (12,529)
Iran
Watertown:
1.7% (160)
Massachusetts:
0.6% (7,213)
Dominican Republic
Watertown:
1.7% (158)
Massachusetts:
8.3% (101,767)
Honduras
Watertown:
1.5% (142)
Massachusetts:
1.1% (13,563)
Place of birth for U.S.-born residents:
This state: 16,460
Other state: 8,779
Northeast: 4,845
Midwest: 1,282
South: 1,400
West: 1,235
82.2% of Watertown residents lived in the same house 1 years ago. Out of people who lived in different houses, 33.6% lived in this county. Out of people who lived in different counties, 70.7% lived in Massachusetts.
Watertown:
82.2%
State average:
87.7%
Education attainment for males 25 years and older:
No schooling: 177
Nursery to 4th grade: 116
5th and 6th grade: 118
7th and 8th grade: 62
9th grade: 42
10th grade: 16
11th grade: 2
12th grade, no diploma: 90
High school graduate (or equivalency): 2,289
Less than 1 year of college: 318
Some college more than 1 year, no degree: 675
Associate degree: 623
Bachelor's degree: 4,571
Master's degree: 2,651
Professional school degree: 447
Doctorate degree: 1,077
Education attainment for females 25 years and older:
No schooling: 232
Nursery to 4th grade: 65
5th and 6th grade: 80
7th and 8th grade: 188
9th grade: 26
10th grade: 43
11th grade: 0
12th grade, no diploma: 115
High school graduate (or equivalency): 1,788
Less than 1 year of college: 479
Some college more than 1 year, no degree: 642
Associate degree: 1,003
Bachelor's degree: 4,338
Master's degree: 3,852
Professional school degree: 649
Doctorate degree: 1,111
Housing units in structures:
One, detached: 3,309
One, attached: 1,818
Two: 5,595
3 or 4: 1,358
5 to 9: 653
10 to 19: 746
20 to 49: 883
50 or more: 2,641
Housing units lacking complete plumbing facilities in 2022: 1.0%
Housing units lacking complete kitchen facilities in 2022: 2.5%
House/condo owner moved in on average 13 years ago