Union City, GA (Georgia) Houses and Residents
Estimated median house or condo value in 2022: $226,076 (it was $75,000 in 2000 )
Union City:
$226,076Georgia:
$297,400
Lower value quartile - upper value quartile: $160,660 - $274,126Total population: 20,427 (Urban population: 11,389, Rural population: 32 (all nonfarm) )
Houses: 12,234 (11,522 occupied: 4,846 owner occupied, 6,795 renter occupied )
% of renters here:
58%State:
34%
Housing density: 1,425 houses/condos per square mile
Median price asked for vacant for-sale houses and condos in 2022: $99,670.
Median contract rent in 2022: $1,077 (lower quartile is $878, upper quartile is $1,264)
Median rent asked for vacant for-rent units in 2022: $1,735
Median gross rent in Union City, GA in 2022: $1,257
Housing units in Union City with a mortgage: 3,728 (117 second mortgage, 0 home equity loan, 68 both second mortgage and home equity loan )Houses without a mortgage: 0
Median household income for houses/condos with a mortgage: $76,126
Median household income for apartments without a mortgage: $58,187
Median monthly housing costs: $1,224
Data:
Median house or condo value ($)
Median house or condo value ($ change since 2000)
Median house or condo value ($) - White
Median house or condo value ($) - Black or African American
Median house or condo value ($) - Asian
Median house or condo value ($) - Hispanic or Latino
Median house or condo value ($) - American Indian and Alaska Native
Median house or condo value ($) - Multirace
Median house or condo value ($) - Other Race
Median price asked for mobile homes ($)
Household density (households per square mile)
Mean house or condo value by units in structure - 1, detached ($)
Mean house or condo value by units in structure - 1, attached ($)
Mean house or condo value by units in structure - 2 ($)
Mean house or condo value by units in structure by units in structure - 3 or 4 ($)
Mean house or condo value by units in structure - 5 or more ($)
Mean house or condo value by units in structure - Boat, RV, van, etc. ($)
Mean house or condo value by units in structure - Mobile home ($)
Median contract rent ($)
Median contract rent - Lower quartile ($)
Median contract rent - Upper quartile ($)
Median gross rent ($)
Urban houses (%)
Rural houses (%)
Houses occupied (%)
Houses occupied (% change since 2000)
Houses owner occupied (%)
Houses owner occupied (% change since 2000)
Houses renter occupied (%)
Houses renter occupied (% change since 2000)
Vacant housing units - For rent (%)
Vacant housing units - For rent (% change since 2000)
Vacant housing units - For sale only (%)
Vacant housing units - For sale only (% change since 2000)
Vacant housing units - Rented or sold, not occupied (%)
Vacant housing units - Rented or sold, not occupied (% change since 2000)
Vacant housing units - For seasonal, recreational, or occasional use (%)
Vacant housing units - For seasonal, recreational, or occasional use (% change since 2000)
Vacant housing units - For migrant workers (%)
Vacant housing units - For migrant workers (% change since 2000)
Vacant housing units - Other vacant (%)
Vacant housing units - Other vacant (% change since 2000)
Median monthly housing costs ($)
Median household income for houses/condos with a mortgage ($)
Median household income for houses/condos without a mortgage ($)
Median household income ($)
Median household income ($) - White
Median household income ($) - Black or African American
Median household income ($) - Asian
Median household income ($) - Hispanic or Latino
Median household income ($) - American Indian and Alaska Native
Median household income ($) - Multirace
Median household income ($) - Other Race
Mortgage status - with mortgage (%)
Mortgage status - with second mortgage (%)
Mortgage status - with home equity loan (%)
Mortgage status - with both second mortgage and home equity loan (%)
Mortgage status - without a mortgage (%)
Median year house/condo built
Median year apartment built
Household type by relationship - Male householder living alone (%)
Household type by relationship - Male householder not living alone (%)
Household type by relationship - Female householder living alone (%)
Household type by relationship - Female householder not living alone (%)
Household type by relationship - Opposite-Sex spouse (%)
Household type by relationship - Same-Sex spouse (%)
Household type by relationship - Opposite-Sex unmarried partner (%)
Household type by relationship - Same-Sex unmarried partner (%)
Household type by relationship - In group quarters (%)
Size of family households - 2-person household (%)
Size of family households - 3-person household (%)
Size of family households - 4-person household (%)
Size of family households - 5-person household (%)
Size of family households - 6-person household (%)
Size of family households - 7-or-more-person household (%)
Size of nonfamily households - 1-person household (%)
Size of nonfamily households - 2-person household (%)
Size of nonfamily households - 3-person household (%)
Size of nonfamily households - 4-person household (%)
Size of nonfamily households - 5-person household (%)
Size of nonfamily households - 6-person household (%)
Size of nonfamily households - 7-or-moreperson household (%)
Year house built - Built 2010 or later (%)
Year house built - Built 2000 to 2009 (%)
Year house built - Built 1990 to 1999 (%)
Year house built - Built 1980 to 1989 (%)
Year house built - Built 1970 to 1979 (%)
Year house built - Built 1960 to 1969 (%)
Year house built - Built 1950 to 1959 (%)
Year house built - Built 1940 to 1949 (%)
Year house built - Built 1939 or earlier (%)
Median number of rooms in houses and condos
Median number of rooms in apartments
Median number of bedrooms in owner occupied houses
Mean number of bedrooms in owner occupied houses
Median number of bedrooms in renter occupied houses
Mean number of bedrooms in renter occupied houses
Median number of vehichles in owner occupied houses
Mean number of vehichles in owner occupied houses
Median number of vehichles in renter occupied houses
Mean number of vehichles in renter occupied houses
Rooms in owner-occupied houses - 1 room (%)
Rooms in owner-occupied houses - 2 rooms (%)
Rooms in owner-occupied houses - 3 rooms (%)
Rooms in owner-occupied houses - 4 rooms (%)
Rooms in owner-occupied houses - 5 rooms (%)
Rooms in owner-occupied houses - 6 rooms (%)
Rooms in owner-occupied houses - 7 rooms (%)
Rooms in owner-occupied houses - 8 rooms (%)
Rooms in owner-occupied houses - 9+ rooms (%)
Rooms in renter-occupied houses - 1 room (%)
Rooms in renter-occupied houses - 2 rooms (%)
Rooms in renter-occupied houses - 3 rooms (%)
Rooms in renter-occupied houses - 4 rooms (%)
Rooms in renter-occupied houses - 5 rooms (%)
Rooms in renter-occupied houses - 6 rooms (%)
Rooms in renter-occupied houses - 7 rooms (%)
Rooms in renter-occupied houses - 8 rooms (%)
Rooms in renter-occupied houses - 9+ rooms (%)
Bedrooms in owner-occupied houses - no bedrooms (%)
Bedrooms in owner-occupied houses - 1 bedroom (%)
Bedrooms in owner-occupied houses - 2 bedrooms (%)
Bedrooms in owner-occupied houses - 3 bedrooms (%)
Bedrooms in owner-occupied houses - 4 bedrooms (%)
Bedrooms in owner-occupied houses - 5+ bedrooms (%)
Bedrooms in renter-occupied houses - no bedrooms (%)
Bedrooms in renter-occupied houses - 1 bedroom (%)
Bedrooms in renter-occupied houses - 2 bedrooms (%)
Bedrooms in renter-occupied houses - 3 bedrooms (%)
Bedrooms in renter-occupied houses - 4 bedrooms (%)
Bedrooms in renter-occupied houses - 5+ bedrooms (%)
Vehicles available in owner-occupied houses - no vehicle available (%)
Vehicles available in owner-occupied houses - 1 vehicle available(%)
Vehicles available in owner-occupied houses - 2 Vehicles available (%)
Vehicles available in owner-occupied houses - 3 Vehicles available (%)
Vehicles available in owner-occupied houses - 4 Vehicles available (%)
Vehicles available in owner-occupied houses - 5+ Vehicles available (%)
Vehicles available in renter-occupied houses - no vehicle available (%)
Vehicles available in renter-occupied houses - 1 vehicle available (%)
Vehicles available in renter-occupied houses - 2 Vehicles available (%)
Vehicles available in renter-occupied houses - 3 Vehicles available (%)
Vehicles available in renter-occupied houses - 4 Vehicles available (%)
Vehicles available in renter-occupied houses - 5+ Vehicles available (%)
Housing units in structures - 1, detached (%)
Housing units in structures - 1, attached (%)
Housing units in structures - 2 (%)
Housing units in structures - 3 or 4 (%)
Housing units in structures - 5 to 9 (%)
Housing units in structures - 10 to 19 (%)
Housing units in structures - 20 to 49 (%)
Housing units in structures - 50 or more (%)
Housing units in structures - Mobile home (%)
Housing units in structures - Boat, RV, van, etc. (%)
Housing units in structures - Owners - 1, detached (%)
Housing units in structures - Owners - 1, attached (%)
Housing units in structures - Owners - 2 (%)
Housing units in structures - Owners - 3 or 4 (%)
Housing units in structures - Owners - 5 to 9 (%)
Housing units in structures - Owners - 10 to 19 (%)
Housing units in structures - Owners - 20 to 49 (%)
Housing units in structures - Owners - 50 or more (%)
Housing units in structures - Owners - Mobile home (%)
Housing units in structures - Owners - Boat, RV, van, etc. (%)
Housing units in structures - Renters - 1, detached (%)
Housing units in structures - Renters - 1, attached (%)
Housing units in structures - Renters - 2 (%)
Housing units in structures - Renters - 3 or 4 (%)
Housing units in structures - Renters - 5 to 9 (%)
Housing units in structures - Renters - 10 to 19 (%)
Housing units in structures - Renters - 20 to 49 (%)
Housing units in structures - Renters - 50 or more (%)
Housing units in structures - Renters - Mobile home (%)
Housing units in structures - Renters - Boat, RV, van, etc. (%)
House/condo owner moved in on average (years ago)
Renter moved in on average (years ago)
Year householder moved into unit - Moved in 1999 to March 2000 (%)
Year householder moved into unit - Moved in 1999 to March 2000 (%) - White
Year householder moved into unit - Moved in 1999 to March 2000 (%) - Black or African American
Year householder moved into unit - Moved in 1999 to March 2000 (%) - Asian
Year householder moved into unit - Moved in 1999 to March 2000 (%) - Hispanic or Latino
Year householder moved into unit - Moved in 1999 to March 2000 (%) - American Indian and Alaska Native
Year householder moved into unit - Moved in 1999 to March 2000 (%) - Multirace
Year householder moved into unit - Moved in 1999 to March 2000 (%) - Other Race
Year householder moved into unit - Moved in 1995 to 1998 (%)
Year householder moved into unit - Moved in 1995 to 1998 (%) - White
Year householder moved into unit - Moved in 1995 to 1998 (%) - Black or African American
Year householder moved into unit - Moved in 1995 to 1998 (%) - Asian
Year householder moved into unit - Moved in 1995 to 1998 (%) - Hispanic or Latino
Year householder moved into unit - Moved in 1995 to 1998 (%) - American Indian and Alaska Native
Year householder moved into unit - Moved in 1995 to 1998 (%) - Multirace
Year householder moved into unit - Moved in 1995 to 1998 (%) - Other Race
Year householder moved into unit - Moved in 1990 to 1994 (%)
Year householder moved into unit - Moved in 1990 to 1994 (%) - White
Year householder moved into unit - Moved in 1990 to 1994 (%) - Black or African American
Year householder moved into unit - Moved in 1990 to 1994 (%) - Asian
Year householder moved into unit - Moved in 1990 to 1994 (%) - Hispanic or Latino
Year householder moved into unit - Moved in 1990 to 1994 (%) - American Indian and Alaska Native
Year householder moved into unit - Moved in 1990 to 1994 (%) - Multirace
Year householder moved into unit - Moved in 1990 to 1994 (%) - Other Race
Year householder moved into unit - Moved in 1980 to 1989 (%)
Year householder moved into unit - Moved in 1980 to 1989 (%) - White
Year householder moved into unit - Moved in 1980 to 1989 (%) - Black or African American
Year householder moved into unit - Moved in 1980 to 1989 (%) - Asian
Year householder moved into unit - Moved in 1980 to 1989 (%) - Hispanic or Latino
Year householder moved into unit - Moved in 1980 to 1989 (%) - American Indian and Alaska Native
Year householder moved into unit - Moved in 1980 to 1989 (%) - Multirace
Year householder moved into unit - Moved in 1980 to 1989 (%) - Other Race
Year householder moved into unit - Moved in 1970 to 1979 (%)
Year householder moved into unit - Moved in 1970 to 1979 (%) - White
Year householder moved into unit - Moved in 1970 to 1979 (%) - Black or African American
Year householder moved into unit - Moved in 1970 to 1979 (%) - Asian
Year householder moved into unit - Moved in 1970 to 1979 (%) - Hispanic or Latino
Year householder moved into unit - Moved in 1970 to 1979 (%) - American Indian and Alaska Native
Year householder moved into unit - Moved in 1970 to 1979 (%) - Multirace
Year householder moved into unit - Moved in 1970 to 1979 (%) - Other Race
Year householder moved into unit - Moved in 1969 or earlier (%)
Year householder moved into unit - Moved in 1969 or earlier (%) - White
Year householder moved into unit - Moved in 1969 or earlier (%) - Black or African American
Year householder moved into unit - Moved in 1969 or earlier (%) - Asian
Year householder moved into unit - Moved in 1969 or earlier (%) - Hispanic or Latino
Year householder moved into unit - Moved in 1969 or earlier (%) - American Indian and Alaska Native
Year householder moved into unit - Moved in 1969 or earlier (%) - Multirace
Year householder moved into unit - Moved in 1969 or earlier (%) - Other Race
Housing units lacking complete plumbing facilities (%)
Housing units lacking complete kitchen facilities (%)
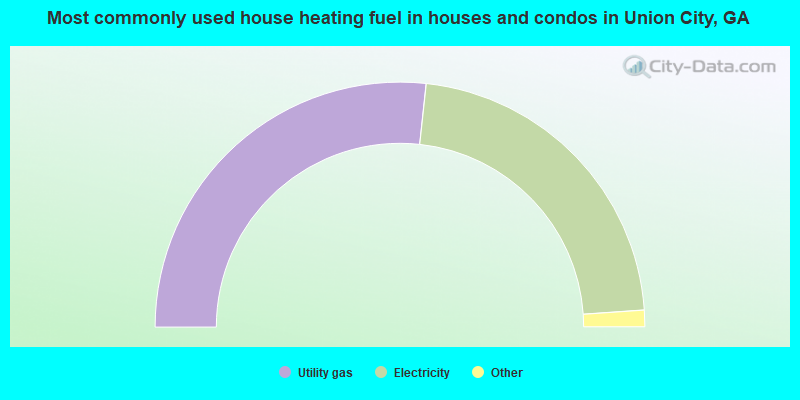
House heating fuel used in houses and condos - Utility gas (%)
House heating fuel used in houses and condos - Bottled, tank, or LP gas (%)
House heating fuel used in houses and condos - Electricity (%)
House heating fuel used in houses and condos - Fuel oil, kerosene, etc. (%)
House heating fuel used in houses and condos - Coal or coke (%)
House heating fuel used in houses and condos - Wood (%)
House heating fuel used in houses and condos - Solar energy (%)
House heating fuel used in houses and condos - Other fuel (%)
House heating fuel used in houses and condos - No fuel used (%)
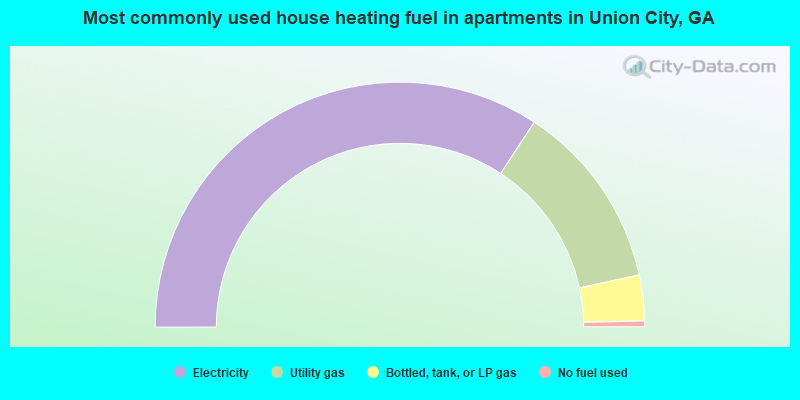
House heating fuel used in apartments - Utility gas (%)
House heating fuel used in apartments - Bottled, tank, or LP gas (%)
House heating fuel used in apartments - Electricity (%)
House heating fuel used in apartments - Fuel oil, kerosene, etc. (%)
House heating fuel used in apartments - Coal or coke (%)
House heating fuel used in apartments - Wood (%)
House heating fuel used in apartments - Solar energy (%)
House heating fuel used in apartments - Other fuel (%)
House heating fuel used in apartments - No fuel used (%)
Median year house/condo built: 2004Median year apartment built: 2003Household type by relationship:
Households: 27,190
Male householders: 3,590 (1,558 living alone ), Female householders: 7,855 (3,007 living alone )2,115 spouses (2,052 opposite-sex spouses ), 605 unmarried partners , (605 opposite-sex unmarried partners ), 8,684 children (8,485 natural , 0 adopted , 199 stepchildren ), 1,529 grandchildren , 933 brothers or sisters , 516 parents , 0 foster children , 574 other relatives , 580 non-relatives In group quarters: 204
Size of family households: 3,039 2-persons , 1,450 3-persons , 1,036 4-persons , 694 5-persons , 161 6-persons , 102 7-or-more-persons .
Size of nonfamily households: 4,653 1-person , 459 2-persons , 76 3-persons .
2,290 married couples with children. single-parent households (106 men , 3,890 women ).
94.0% of residents of Union City speak English at home. of residents speak Spanish at home (68% speak English very well , 6% speak English well , 20% speak English not well , 6% don't speak English at all ).of residents speak other Indo-European language at home (93% speak English very well , 3% speak English well , 4% speak English not well ).of residents speak other language at home (74% speak English very well , 9% speak English well , 11% speak English not well , 5% don't speak English at all ).
Foreign born population: 1,384 (5.1%)of them are naturalized citizens )
Median number of rooms in houses and condos:
Median number of rooms in apartments
Union City, GA household income distribution 633 Less than $10,0001,277 $10,000 to $19,999795 $20,000 to $29,9992,002 $30,000 to $39,9991,064 $40,000 to $49,999708 $50,000 to $59,999918 $60,000 to $74,9991,482 $75,000 to $99,9991,177 $100,000 to $124,999635 $125,000 to $149,999423 $150,000 to $199,999179 $200,000 or more
Home value of owner - occupied houses in 2022 in Union City, GA 204 Less than $10,00052 $15,000 to $19,99933 $20,000 to $24,99948 $30,000 to $34,99949 $35,000 to $39,99933 $40,000 to $49,99951 $50,000 to $59,999119 $60,000 to $69,99997 $80,000 to $89,999279 $100,000 to $124,99982 $125,000 to $149,999417 $150,000 to $174,999369 $175,000 to $199,999941 $200,000 to $249,999594 $250,000 to $299,999724 $300,000 to $399,999100 $400,000 to $499,99915 $2,000,000 or moreRent paid by renters in 2022 in Union City, GA 163 $100 to $14972 $150 to $19926 $200 to $249139 $250 to $299123 $300 to $34961 $350 to $3997 $400 to $44971 $450 to $49969 $500 to $54910 $550 to $59968 $600 to $64991 $650 to $699168 $700 to $749130 $750 to $799646 $800 to $899865 $900 to $9991,521 $1,000 to $1,249376 $1,250 to $1,499647 $1,500 to $1,999199 $2,000 to $2,49914 $3,500 or more207 No cash rent
Percentage of workers working in this county: 69.2%Number of people working at home: 1,662 (12.5% of all workers )
Travel time to work (commute)
Less than 5 minutes: 1285 to 9 minutes: 81410 to 14 minutes: 1,33615 to 19 minutes: 1,63120 to 24 minutes: 1,33725 to 29 minutes: 1,02330 to 34 minutes: 2,20935 to 39 minutes: 50640 to 44 minutes: 35145 to 59 minutes: 92860 to 89 minutes: 45490 or more minutes: 177
Means of transportation to work:
Drove a car alone: 7,444 (71.7%)Carpooled: 937 (9.0%)Bus : 146 (1.4%)Light rail, streetcar or trolley : 58 (0.6%)Taxi: 69 (0.7%)Walked: 66 (0.6%)Worked at home: 1,662 (16.0%)
Unemployment by race in 2022
Unemployment rate for Black residents 4.9% Males4.2% Females
Year of entry for the foreign-born population in Union City, Georgia
411 2010 or later 112 2000 to 2009 495 1990 to 1999 186 1980 to 1989 65 1970 to 1979 50 Before 1970
First ancestries reported:
African: 790 (4.2%)
Nigerian: 426 (2.3%)
Jamaican: 297 (1.6%)
American: 216 (1.2%)
English: 156 (0.8%)
German: 99 (0.5%)
West Indian: 84 (0.4%)
Irish: 49 (0.3%)
European: 46 (0.2%)
Scotch-Irish: 44 (0.2%)
Canadian: 38 (0.2%)
Haitian: 37 (0.2%)
Portuguese: 35 (0.2%)
Ghanaian: 12 (0.06%) Most common places of birth for foreign-born residents (%): Jamaica Union City:
24.0% (346)Georgia:
4.6% (51,270)
Mexico Union City:
19.4% (280)Georgia:
20.0% (223,400)
Nigeria Union City:
11.6% (167)Georgia:
2.5% (27,846)
St. Vincent and the Grenadines Union City:
9.2% (133)Georgia:
0.1% (776)
Honduras Union City:
6.7% (97)Georgia:
2.1% (23,500)
Ghana Union City:
5.5% (80)Georgia:
1.0% (11,747)
Guatemala Union City:
5.5% (79)Georgia:
3.6% (39,974)
Peru Union City:
4.9% (70)Georgia:
0.8% (8,613)
Other Western Africa Union City:
3.8% (55)Georgia:
0.4% (4,565)
Ethiopia Union City:
3.1% (45)Georgia:
1.6% (17,643)
Other Northern America Union City:
3.0% (43)Georgia:
0.1% (570)
Canada Union City:
2.4% (35)Georgia:
1.6% (17,851)
Haiti Union City:
2.3% (33)Georgia:
1.6% (17,476)
Trinidad and Tobago Union City:
2.0% (29)Georgia:
0.8% (8,684)
Africa, n.e.c. Union City:
1.8% (26)Georgia:
0.3% (3,603)
Place of birth for U.S.-born residents:
This state: 17,512Other state: 7,435Northeast: 1,632Midwest: 984South: 4,389West: 519 87.2% of Union City residents lived in the same house 1 years ago.
Out of people who lived in different houses, 26.4% lived in this county.
Out of people who lived in different counties, 63.4% lived in Georgia.
Union City:
87.2%State average:
86.6%
Education attainment for males 25 years and older:
No schooling: 57Nursery to 4th grade: 25th and 6th grade: 297th and 8th grade: 2349th grade: 010th grade: 3611th grade: 16012th grade, no diploma: 438High school graduate (or equivalency): 1,871Less than 1 year of college: 702Some college more than 1 year, no degree: 716Associate degree: 1,120Bachelor's degree: 835Master's degree: 534Professional school degree: 0Doctorate degree: 19
Education attainment for females 25 years and older:
No schooling: 72Nursery to 4th grade: 05th and 6th grade: 797th and 8th grade: 679th grade: 010th grade: 24111th grade: 10012th grade, no diploma: 185High school graduate (or equivalency): 2,013Less than 1 year of college: 541Some college more than 1 year, no degree: 1,748Associate degree: 1,353Bachelor's degree: 2,420Master's degree: 1,070Professional school degree: 4Doctorate degree: 150
Housing units in structures:
One, detached: 5,935One, attached: 1,091Two: 713 or 4: 5315 to 9: 2,20610 to 19: 1,37120 to 49: 20150 or more: 601Mobile homes: 224Housing units lacking complete plumbing facilities in 2022: 1.1%Housing units lacking complete kitchen facilities in 2022: 2.1%House/condo owner moved in on average 9 years ago
Renter moved in on average 4 years ago
Private vs. public school enrollment:
Students in private schools in grades 1 to 8 (elementary and middle school): 370 Students in private schools in grades 9 to 12 (high school): 0 Students in private undergraduate colleges: 171