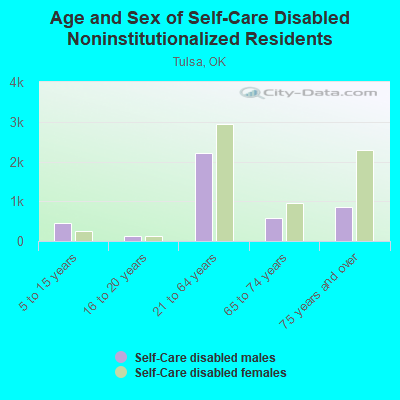
Tulsa, OK (Oklahoma) Houses and Residents
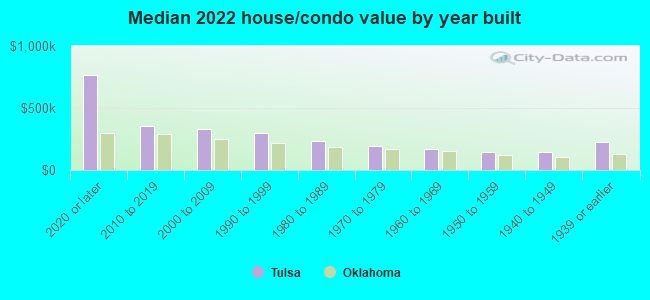
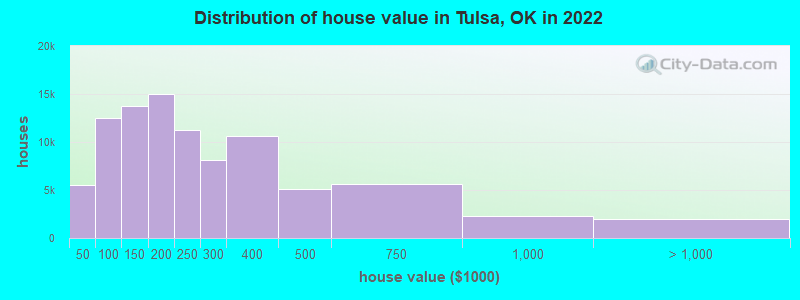
Estimated median house or condo value in 2022: $199,600 (it was $81,900 in 2000 )
Tulsa:
$199,600Oklahoma:
$191,700
Lower value quartile - upper value quartile: $119,000 - $329,600Mean price in 2022: Detached houses: $287,211 Here:
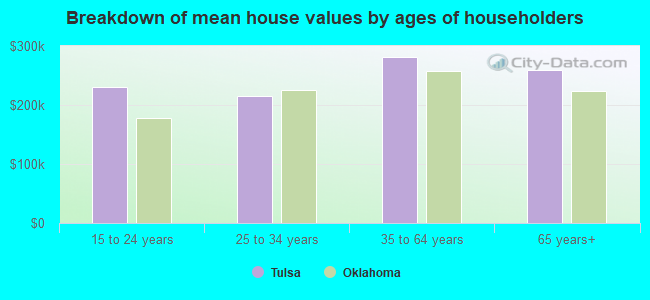
$287,211State:
$255,409
Townhouses or other attached units: $182,112 Here:
$182,112State:
$206,466
In 2-unit structures: $374,039 Here:
$374,039State:
$195,100
In 3-to-4-unit structures: $141,586 Here:
$141,586State:
$140,612
In 5-or-more-unit structures: $205,125 Here:
$205,125State:
$233,805
Mobile homes: $58,926 Here:
$58,926State:
$110,804
Occupied boats, RVs, vans, etc.: $133,193 Here:
$133,193State:
$68,690
Total population: 399,682 (Urban population: 390,406, Rural population: 2,645 (9 farm, 2,636 nonfarm ))
Houses: 194,541 (175,943 occupied: 90,197 owner occupied, 85,746 renter occupied )
% of renters here:
49%State:
35%
Housing density: 1,065 houses/condos per square mile
Median price asked for vacant for-sale houses and condos in 2022: $190,172.
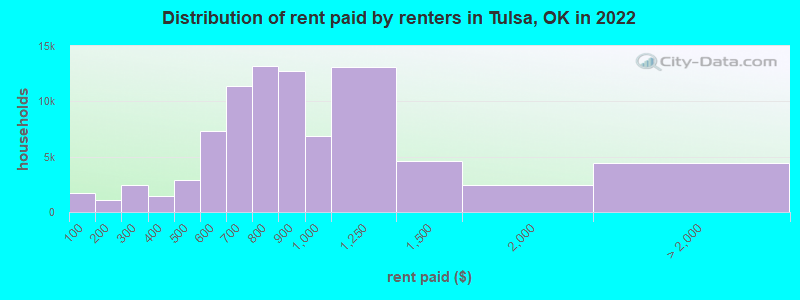
Median contract rent in 2022: $802 (lower quartile is $632, upper quartile is $1,027)
Median rent asked for vacant for-rent units in 2022: $1,054
Median gross rent in Tulsa, OK in 2022: $971
Housing units in Tulsa with a mortgage: 51,668 (3,582 second mortgage, 193 home equity loan, 2,257 both second mortgage and home equity loan )Houses without a mortgage: 1,084
Median household income for houses/condos with a mortgage: $89,765
Median household income for apartments without a mortgage: $60,784
Median monthly housing costs: $990
Data:
Median house or condo value ($)
Median house or condo value ($ change since 2000)
Median house or condo value ($) - White
Median house or condo value ($) - Black or African American
Median house or condo value ($) - Asian
Median house or condo value ($) - Hispanic or Latino
Median house or condo value ($) - American Indian and Alaska Native
Median house or condo value ($) - Multirace
Median house or condo value ($) - Other Race
Median price asked for mobile homes ($)
Household density (households per square mile)
Mean house or condo value by units in structure - 1, detached ($)
Mean house or condo value by units in structure - 1, attached ($)
Mean house or condo value by units in structure - 2 ($)
Mean house or condo value by units in structure by units in structure - 3 or 4 ($)
Mean house or condo value by units in structure - 5 or more ($)
Mean house or condo value by units in structure - Boat, RV, van, etc. ($)
Mean house or condo value by units in structure - Mobile home ($)
Median contract rent ($)
Median contract rent - Lower quartile ($)
Median contract rent - Upper quartile ($)
Median gross rent ($)
Urban houses (%)
Rural houses (%)
Houses occupied (%)
Houses occupied (% change since 2000)
Houses owner occupied (%)
Houses owner occupied (% change since 2000)
Houses renter occupied (%)
Houses renter occupied (% change since 2000)
Vacant housing units - For rent (%)
Vacant housing units - For rent (% change since 2000)
Vacant housing units - For sale only (%)
Vacant housing units - For sale only (% change since 2000)
Vacant housing units - Rented or sold, not occupied (%)
Vacant housing units - Rented or sold, not occupied (% change since 2000)
Vacant housing units - For seasonal, recreational, or occasional use (%)
Vacant housing units - For seasonal, recreational, or occasional use (% change since 2000)
Vacant housing units - For migrant workers (%)
Vacant housing units - For migrant workers (% change since 2000)
Vacant housing units - Other vacant (%)
Vacant housing units - Other vacant (% change since 2000)
Median monthly housing costs ($)
Median household income for houses/condos with a mortgage ($)
Median household income for houses/condos without a mortgage ($)
Median household income ($)
Median household income ($) - White
Median household income ($) - Black or African American
Median household income ($) - Asian
Median household income ($) - Hispanic or Latino
Median household income ($) - American Indian and Alaska Native
Median household income ($) - Multirace
Median household income ($) - Other Race
Mortgage status - with mortgage (%)
Mortgage status - with second mortgage (%)
Mortgage status - with home equity loan (%)
Mortgage status - with both second mortgage and home equity loan (%)
Mortgage status - without a mortgage (%)
Median year house/condo built
Median year apartment built
Household type by relationship - Male householder living alone (%)
Household type by relationship - Male householder not living alone (%)
Household type by relationship - Female householder living alone (%)
Household type by relationship - Female householder not living alone (%)
Household type by relationship - Opposite-Sex spouse (%)
Household type by relationship - Same-Sex spouse (%)
Household type by relationship - Opposite-Sex unmarried partner (%)
Household type by relationship - Same-Sex unmarried partner (%)
Household type by relationship - In group quarters (%)
Size of family households - 2-person household (%)
Size of family households - 3-person household (%)
Size of family households - 4-person household (%)
Size of family households - 5-person household (%)
Size of family households - 6-person household (%)
Size of family households - 7-or-more-person household (%)
Size of nonfamily households - 1-person household (%)
Size of nonfamily households - 2-person household (%)
Size of nonfamily households - 3-person household (%)
Size of nonfamily households - 4-person household (%)
Size of nonfamily households - 5-person household (%)
Size of nonfamily households - 6-person household (%)
Size of nonfamily households - 7-or-moreperson household (%)
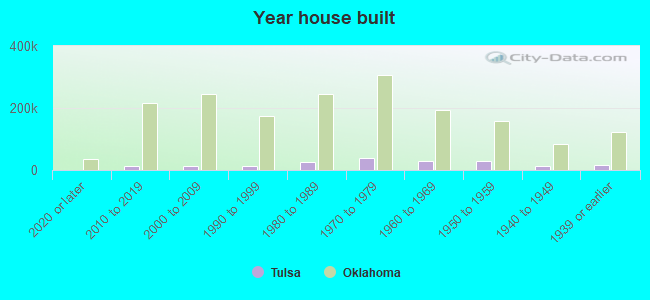
Year house built - Built 2010 or later (%)
Year house built - Built 2000 to 2009 (%)
Year house built - Built 1990 to 1999 (%)
Year house built - Built 1980 to 1989 (%)
Year house built - Built 1970 to 1979 (%)
Year house built - Built 1960 to 1969 (%)
Year house built - Built 1950 to 1959 (%)
Year house built - Built 1940 to 1949 (%)
Year house built - Built 1939 or earlier (%)
Median number of rooms in houses and condos
Median number of rooms in apartments
Median number of bedrooms in owner occupied houses
Mean number of bedrooms in owner occupied houses
Median number of bedrooms in renter occupied houses
Mean number of bedrooms in renter occupied houses
Median number of vehichles in owner occupied houses
Mean number of vehichles in owner occupied houses
Median number of vehichles in renter occupied houses
Mean number of vehichles in renter occupied houses
Rooms in owner-occupied houses - 1 room (%)
Rooms in owner-occupied houses - 2 rooms (%)
Rooms in owner-occupied houses - 3 rooms (%)
Rooms in owner-occupied houses - 4 rooms (%)
Rooms in owner-occupied houses - 5 rooms (%)
Rooms in owner-occupied houses - 6 rooms (%)
Rooms in owner-occupied houses - 7 rooms (%)
Rooms in owner-occupied houses - 8 rooms (%)
Rooms in owner-occupied houses - 9+ rooms (%)
Rooms in renter-occupied houses - 1 room (%)
Rooms in renter-occupied houses - 2 rooms (%)
Rooms in renter-occupied houses - 3 rooms (%)
Rooms in renter-occupied houses - 4 rooms (%)
Rooms in renter-occupied houses - 5 rooms (%)
Rooms in renter-occupied houses - 6 rooms (%)
Rooms in renter-occupied houses - 7 rooms (%)
Rooms in renter-occupied houses - 8 rooms (%)
Rooms in renter-occupied houses - 9+ rooms (%)
Bedrooms in owner-occupied houses - no bedrooms (%)
Bedrooms in owner-occupied houses - 1 bedroom (%)
Bedrooms in owner-occupied houses - 2 bedrooms (%)
Bedrooms in owner-occupied houses - 3 bedrooms (%)
Bedrooms in owner-occupied houses - 4 bedrooms (%)
Bedrooms in owner-occupied houses - 5+ bedrooms (%)
Bedrooms in renter-occupied houses - no bedrooms (%)
Bedrooms in renter-occupied houses - 1 bedroom (%)
Bedrooms in renter-occupied houses - 2 bedrooms (%)
Bedrooms in renter-occupied houses - 3 bedrooms (%)
Bedrooms in renter-occupied houses - 4 bedrooms (%)
Bedrooms in renter-occupied houses - 5+ bedrooms (%)
Vehicles available in owner-occupied houses - no vehicle available (%)
Vehicles available in owner-occupied houses - 1 vehicle available(%)
Vehicles available in owner-occupied houses - 2 Vehicles available (%)
Vehicles available in owner-occupied houses - 3 Vehicles available (%)
Vehicles available in owner-occupied houses - 4 Vehicles available (%)
Vehicles available in owner-occupied houses - 5+ Vehicles available (%)
Vehicles available in renter-occupied houses - no vehicle available (%)
Vehicles available in renter-occupied houses - 1 vehicle available (%)
Vehicles available in renter-occupied houses - 2 Vehicles available (%)
Vehicles available in renter-occupied houses - 3 Vehicles available (%)
Vehicles available in renter-occupied houses - 4 Vehicles available (%)
Vehicles available in renter-occupied houses - 5+ Vehicles available (%)
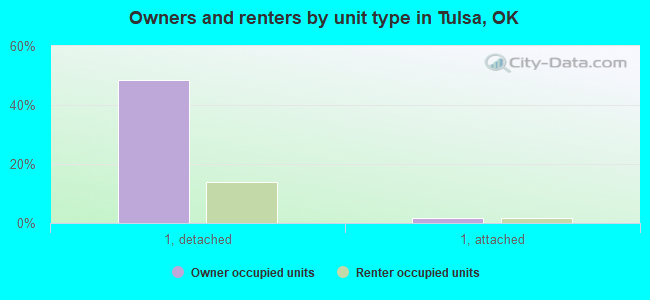
Housing units in structures - 1, detached (%)
Housing units in structures - 1, attached (%)
Housing units in structures - 2 (%)
Housing units in structures - 3 or 4 (%)
Housing units in structures - 5 to 9 (%)
Housing units in structures - 10 to 19 (%)
Housing units in structures - 20 to 49 (%)
Housing units in structures - 50 or more (%)
Housing units in structures - Mobile home (%)
Housing units in structures - Boat, RV, van, etc. (%)
Housing units in structures - Owners - 1, detached (%)
Housing units in structures - Owners - 1, attached (%)
Housing units in structures - Owners - 2 (%)
Housing units in structures - Owners - 3 or 4 (%)
Housing units in structures - Owners - 5 to 9 (%)
Housing units in structures - Owners - 10 to 19 (%)
Housing units in structures - Owners - 20 to 49 (%)
Housing units in structures - Owners - 50 or more (%)
Housing units in structures - Owners - Mobile home (%)
Housing units in structures - Owners - Boat, RV, van, etc. (%)
Housing units in structures - Renters - 1, detached (%)
Housing units in structures - Renters - 1, attached (%)
Housing units in structures - Renters - 2 (%)
Housing units in structures - Renters - 3 or 4 (%)
Housing units in structures - Renters - 5 to 9 (%)
Housing units in structures - Renters - 10 to 19 (%)
Housing units in structures - Renters - 20 to 49 (%)
Housing units in structures - Renters - 50 or more (%)
Housing units in structures - Renters - Mobile home (%)
Housing units in structures - Renters - Boat, RV, van, etc. (%)
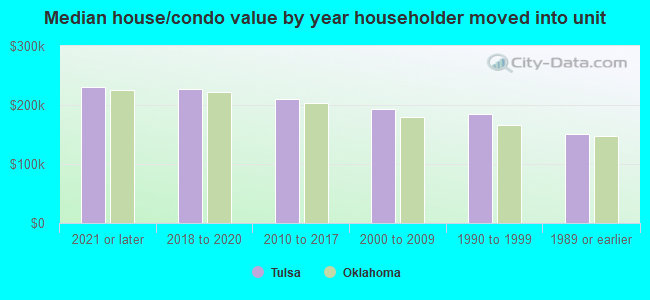
House/condo owner moved in on average (years ago)
Renter moved in on average (years ago)
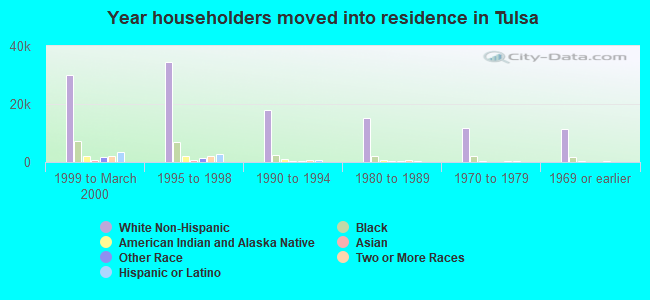
Year householder moved into unit - Moved in 1999 to March 2000 (%)
Year householder moved into unit - Moved in 1999 to March 2000 (%) - White
Year householder moved into unit - Moved in 1999 to March 2000 (%) - Black or African American
Year householder moved into unit - Moved in 1999 to March 2000 (%) - Asian
Year householder moved into unit - Moved in 1999 to March 2000 (%) - Hispanic or Latino
Year householder moved into unit - Moved in 1999 to March 2000 (%) - American Indian and Alaska Native
Year householder moved into unit - Moved in 1999 to March 2000 (%) - Multirace
Year householder moved into unit - Moved in 1999 to March 2000 (%) - Other Race
Year householder moved into unit - Moved in 1995 to 1998 (%)
Year householder moved into unit - Moved in 1995 to 1998 (%) - White
Year householder moved into unit - Moved in 1995 to 1998 (%) - Black or African American
Year householder moved into unit - Moved in 1995 to 1998 (%) - Asian
Year householder moved into unit - Moved in 1995 to 1998 (%) - Hispanic or Latino
Year householder moved into unit - Moved in 1995 to 1998 (%) - American Indian and Alaska Native
Year householder moved into unit - Moved in 1995 to 1998 (%) - Multirace
Year householder moved into unit - Moved in 1995 to 1998 (%) - Other Race
Year householder moved into unit - Moved in 1990 to 1994 (%)
Year householder moved into unit - Moved in 1990 to 1994 (%) - White
Year householder moved into unit - Moved in 1990 to 1994 (%) - Black or African American
Year householder moved into unit - Moved in 1990 to 1994 (%) - Asian
Year householder moved into unit - Moved in 1990 to 1994 (%) - Hispanic or Latino
Year householder moved into unit - Moved in 1990 to 1994 (%) - American Indian and Alaska Native
Year householder moved into unit - Moved in 1990 to 1994 (%) - Multirace
Year householder moved into unit - Moved in 1990 to 1994 (%) - Other Race
Year householder moved into unit - Moved in 1980 to 1989 (%)
Year householder moved into unit - Moved in 1980 to 1989 (%) - White
Year householder moved into unit - Moved in 1980 to 1989 (%) - Black or African American
Year householder moved into unit - Moved in 1980 to 1989 (%) - Asian
Year householder moved into unit - Moved in 1980 to 1989 (%) - Hispanic or Latino
Year householder moved into unit - Moved in 1980 to 1989 (%) - American Indian and Alaska Native
Year householder moved into unit - Moved in 1980 to 1989 (%) - Multirace
Year householder moved into unit - Moved in 1980 to 1989 (%) - Other Race
Year householder moved into unit - Moved in 1970 to 1979 (%)
Year householder moved into unit - Moved in 1970 to 1979 (%) - White
Year householder moved into unit - Moved in 1970 to 1979 (%) - Black or African American
Year householder moved into unit - Moved in 1970 to 1979 (%) - Asian
Year householder moved into unit - Moved in 1970 to 1979 (%) - Hispanic or Latino
Year householder moved into unit - Moved in 1970 to 1979 (%) - American Indian and Alaska Native
Year householder moved into unit - Moved in 1970 to 1979 (%) - Multirace
Year householder moved into unit - Moved in 1970 to 1979 (%) - Other Race
Year householder moved into unit - Moved in 1969 or earlier (%)
Year householder moved into unit - Moved in 1969 or earlier (%) - White
Year householder moved into unit - Moved in 1969 or earlier (%) - Black or African American
Year householder moved into unit - Moved in 1969 or earlier (%) - Asian
Year householder moved into unit - Moved in 1969 or earlier (%) - Hispanic or Latino
Year householder moved into unit - Moved in 1969 or earlier (%) - American Indian and Alaska Native
Year householder moved into unit - Moved in 1969 or earlier (%) - Multirace
Year householder moved into unit - Moved in 1969 or earlier (%) - Other Race
Housing units lacking complete plumbing facilities (%)
Housing units lacking complete kitchen facilities (%)
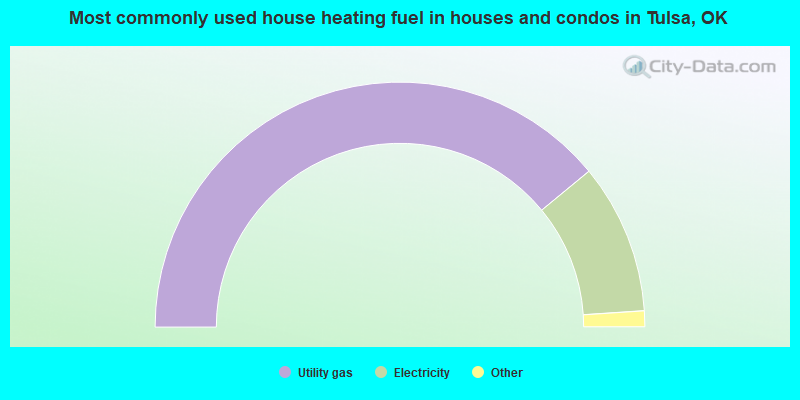
House heating fuel used in houses and condos - Utility gas (%)
House heating fuel used in houses and condos - Bottled, tank, or LP gas (%)
House heating fuel used in houses and condos - Electricity (%)
House heating fuel used in houses and condos - Fuel oil, kerosene, etc. (%)
House heating fuel used in houses and condos - Coal or coke (%)
House heating fuel used in houses and condos - Wood (%)
House heating fuel used in houses and condos - Solar energy (%)
House heating fuel used in houses and condos - Other fuel (%)
House heating fuel used in houses and condos - No fuel used (%)
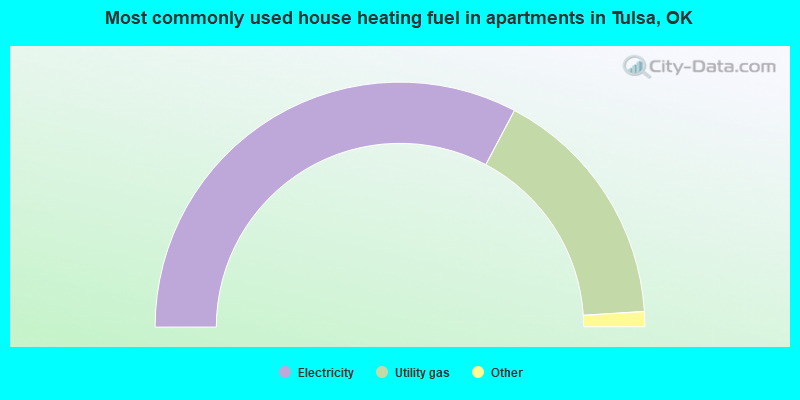
House heating fuel used in apartments - Utility gas (%)
House heating fuel used in apartments - Bottled, tank, or LP gas (%)
House heating fuel used in apartments - Electricity (%)
House heating fuel used in apartments - Fuel oil, kerosene, etc. (%)
House heating fuel used in apartments - Coal or coke (%)
House heating fuel used in apartments - Wood (%)
House heating fuel used in apartments - Solar energy (%)
House heating fuel used in apartments - Other fuel (%)
House heating fuel used in apartments - No fuel used (%)
Latest news about housing in Tulsa, OK collected exclusively by city-data.com from local newspapers, TV, and radio stations
Median year house/condo built: 1969Median year apartment built: 1976Household type by relationship:
Households: 413,142
Male householders: 84,656 (28,944 living alone ), Female householders: 91,287 (33,984 living alone )63,629 spouses (62,674 opposite-sex spouses ), 13,139 unmarried partners , (12,197 opposite-sex unmarried partners ), 113,493 children (106,318 natural , 2,931 adopted , 4,244 stepchildren ), 8,699 grandchildren , 5,548 brothers or sisters , 3,981 parents , 491 foster children , 5,307 other relatives , 13,006 non-relatives In group quarters: 9,906
Size of family households: 43,958 2-persons , 22,129 3-persons , 17,129 4-persons , 8,056 5-persons , 3,112 6-persons , 2,282 7-or-more-persons .
Size of nonfamily households: 62,928 1-person , 14,533 2-persons , 1,161 3-persons , 460 4-persons , 116 5-persons , 50 6-persons , 29 7-or-more-persons .
53,387 married couples with children. single-parent households (6,593 men , 27,601 women ).
79.9% of residents of Tulsa speak English at home. of residents speak Spanish at home (55% speak English very well , 16% speak English well , 17% speak English not well , 11% don't speak English at all ).of residents speak other Indo-European language at home (66% speak English very well , 20% speak English well , 8% speak English not well , 6% don't speak English at all ).of residents speak Asian or Pacific Island language at home (53% speak English very well , 24% speak English well , 16% speak English not well , 7% don't speak English at all ).of residents speak other language at home (72% speak English very well , 22% speak English well , 4% speak English not well , 1% don't speak English at all ).
Foreign born population: 48,927 (11.8%)of them are naturalized citizens )
Median number of rooms in houses and condos:
Median number of rooms in apartments
Owner-occupied Renter-occupied
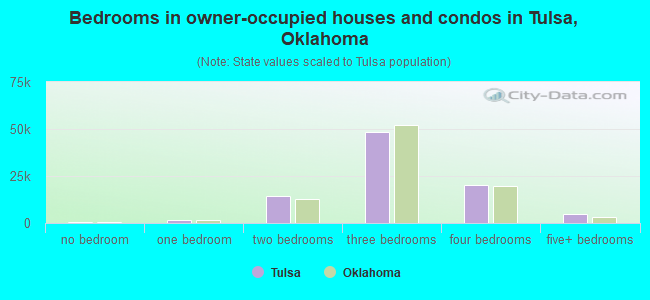
Bedrooms in owner-occupied houses and condos in Tulsa, Oklahoma
274 no bedroom 1,553 1 bedroom 14,545 2 bedrooms 48,611 3 bedrooms 20,265 4 bedrooms 4,949 5+ bedrooms
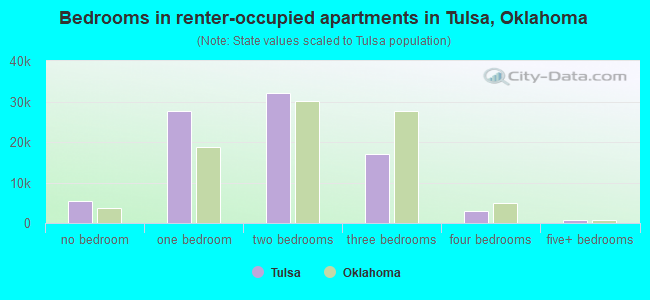
Bedrooms in renter-occupied apartments in Tulsa, Oklahoma
5,442 no bedroom 27,737 1 bedroom 32,038 2 bedrooms 16,918 3 bedrooms 2,934 4 bedrooms 677 5+ bedrooms
Owner-occupied Renter-occupied
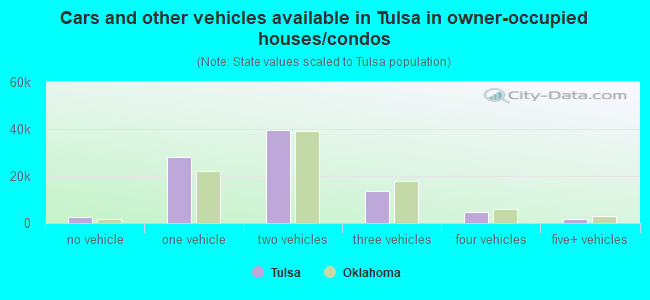
Cars and other vehicles available in Tulsa in owner-occupied houses/condos
2,374 no vehicle 27,927 1 vehicle 39,637 2 vehicles 13,747 3 vehicles 4,750 4 vehicles 1,762 5+ vehicles
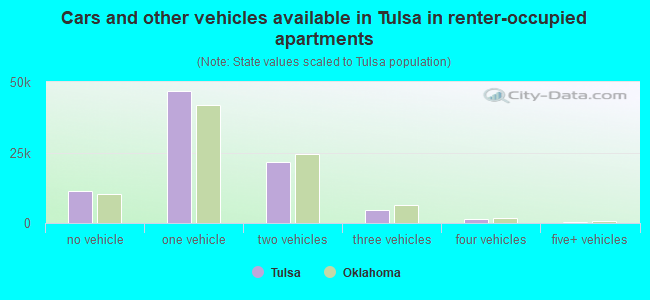
Cars and other vehicles available in Tulsa in renter-occupied apartments
11,203 no vehicle 46,869 1 vehicle 21,581 2 vehicles 4,440 3 vehicles 1,354 4 vehicles 299 5+ vehicles
Owner-occupied Renter-occupied
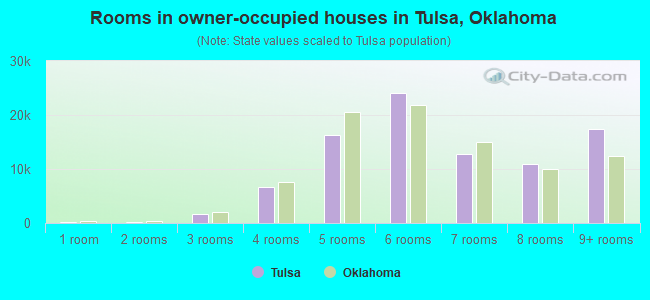
Rooms in owner-occupied houses in Tulsa, Oklahoma
155 1 room 194 2 rooms 1,714 3 rooms 6,609 4 rooms 16,366 5 rooms 24,066 6 rooms 12,798 7 rooms 10,878 8 rooms 17,417 9+ rooms
Rooms in renter-occupied apartments in Tulsa, Oklahoma
5,010 1 room 7,445 2 rooms 19,328 3 rooms 22,861 4 rooms 14,543 5 rooms 9,686 6 rooms 3,728 7 rooms 1,444 8 rooms 1,701 9+ rooms
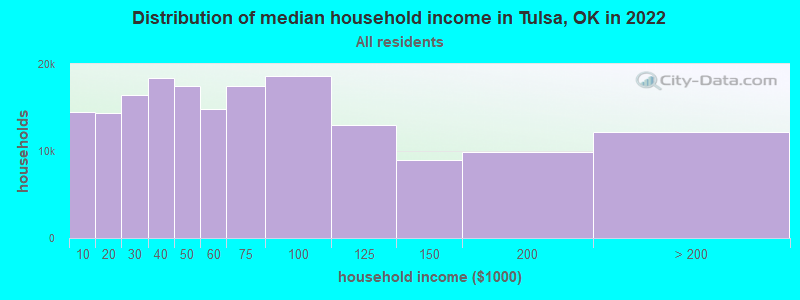
Tulsa, OK household income distribution 14,500 Less than $10,00014,318 $10,000 to $19,99916,428 $20,000 to $29,99918,426 $30,000 to $39,99917,485 $40,000 to $49,99914,771 $50,000 to $59,99917,480 $60,000 to $74,99918,581 $75,000 to $99,99912,975 $100,000 to $124,9998,999 $125,000 to $149,9999,842 $150,000 to $199,99912,138 $200,000 or more
Home value of owner - occupied houses in 2022 in Tulsa, OK 872 Less than $10,000499 $10,000 to $14,999606 $15,000 to $19,999397 $20,000 to $24,999359 $25,000 to $29,999809 $30,000 to $34,999365 $35,000 to $39,9991,643 $40,000 to $49,9991,656 $50,000 to $59,9991,852 $60,000 to $69,9991,862 $70,000 to $79,9993,010 $80,000 to $89,9992,521 $90,000 to $99,9998,028 $100,000 to $124,9995,741 $125,000 to $149,9999,206 $150,000 to $174,9995,760 $175,000 to $199,99911,242 $200,000 to $249,9998,083 $250,000 to $299,99910,600 $300,000 to $399,9995,153 $400,000 to $499,9995,663 $500,000 to $749,9992,248 $750,000 to $999,9991,203 $1,000,000 to $1,499,999373 $1,500,000 to $1,999,999446 $2,000,000 or moreRent paid by renters in 2022 in Tulsa, OK 1,739 Less than $100536 $100 to $149572 $150 to $1991,675 $200 to $249766 $250 to $299811 $300 to $349652 $350 to $3991,618 $400 to $4491,317 $450 to $4993,039 $500 to $5494,250 $550 to $5996,019 $600 to $6495,381 $650 to $6997,443 $700 to $7495,710 $750 to $79912,771 $800 to $8996,911 $900 to $99913,085 $1,000 to $1,2494,587 $1,250 to $1,4992,406 $1,500 to $1,9991,052 $2,000 to $2,499376 $2,500 to $2,999305 $3,000 to $3,499480 $3,500 or more2,245 No cash rent
Percentage of workers working in this county: 92.5%Number of people working at home: 21,190 (10.8% of all workers )
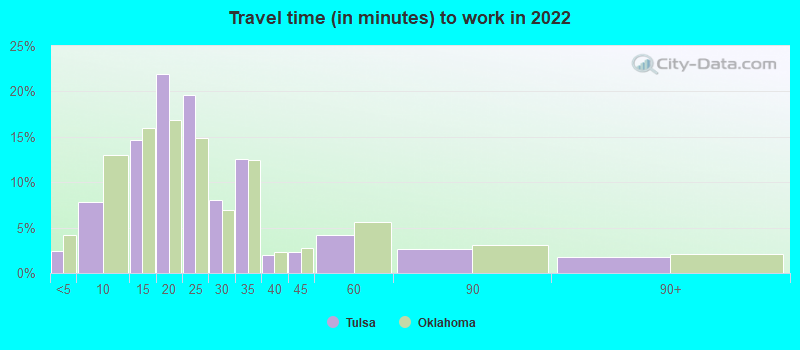
Travel time to work (commute)
Less than 5 minutes: 5,6125 to 9 minutes: 18,86410 to 14 minutes: 33,87415 to 19 minutes: 49,13320 to 24 minutes: 33,71625 to 29 minutes: 9,07030 to 34 minutes: 14,82935 to 39 minutes: 1,32140 to 44 minutes: 1,75545 to 59 minutes: 2,80560 to 89 minutes: 2,73190 or more minutes: 1,978
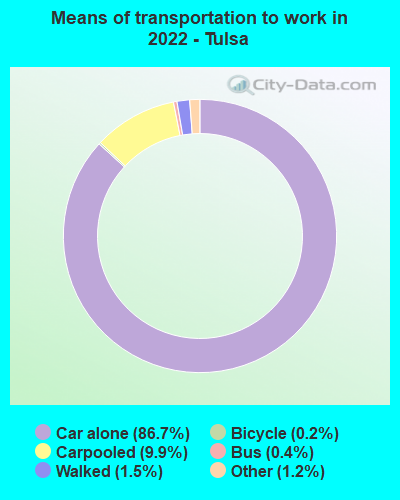
Means of transportation to work:
Drove a car alone: 225,807 (80.2%)Carpooled: 25,882 (9.2%)Bus : 1,045 (0.4%)Taxi: 3,099 (1.1%)Bicycle: 586 (0.2%)Walked: 3,878 (1.4%)Worked at home: 21,190 (7.5%)
Unemployment by race in 2022
Unemployment rate for White non-Hispanic residents 3.3% Males3.3% FemalesUnemployment rate for Black residents 8.8% Males9.2% FemalesUnemployment rate for American Indian and Alaska Native residents 5.7% Males17.0% FemalesUnemployment rate for Asian residents 3.9% Males8.7% FemalesUnemployment rate for other race residents 1.1% Males6.4% FemalesUnemployment rate for two or more race residents 3.8% Males6.5% FemalesUnemployment rate for Hispanic or Latino residents 2.8% Males6.9% Females
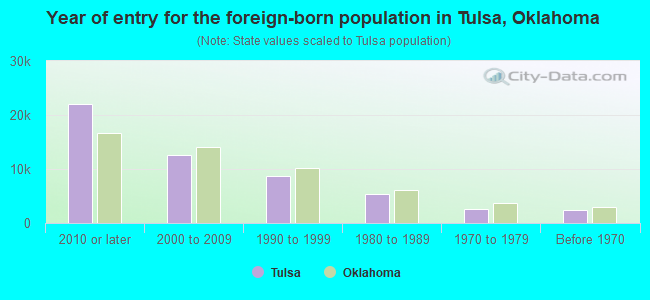
Year of entry for the foreign-born population in Tulsa, Oklahoma
21,996 2010 or later 12,581 2000 to 2009 8,661 1990 to 1999 5,445 1980 to 1989 2,564 1970 to 1979 2,320 Before 1970
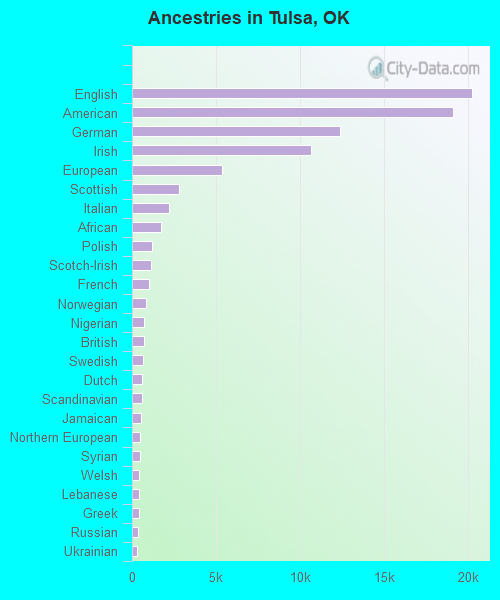
First ancestries reported:
English: 20,268 (9.2%)
American: 19,162 (8.7%)
German: 12,391 (5.6%)
Irish: 10,664 (4.9%)
European: 5,341 (2.4%)
Scottish: 2,803 (1.3%)
Italian: 2,199 (1.0%)
African: 1,724 (0.8%)
Polish: 1,201 (0.5%)
Scotch-Irish: 1,144 (0.5%)
French: 1,043 (0.5%)
Norwegian: 850 (0.4%)
Nigerian: 735 (0.3%)
British: 693 (0.3%)
Swedish: 639 (0.3%)
Dutch: 616 (0.3%)
Scandinavian: 594 (0.3%)
Jamaican: 519 (0.2%)
Northern European: 500 (0.2%)
Syrian: 485 (0.2%)
Welsh: 446 (0.2%)
Lebanese: 440 (0.2%)
Greek: 421 (0.2%)
Russian: 341 (0.2%)
Ukrainian: 303 (0.1%)
Egyptian: 300 (0.1%)
Afghan: 297 (0.1%)
Eastern European: 279 (0.1%)
Portuguese: 262 (0.1%)
Brazilian: 248 (0.1%)
Iranian: 238 (0.1%)
French Canadian: 233 (0.1%)
Czech: 232 (0.1%)
Romanian: 228 (0.1%)
Haitian: 180 (0.08%)
Danish: 168 (0.08%)
Hungarian: 157 (0.07%)
West Indian: 153 (0.07%)
Turkish: 150 (0.07%)
Kenyan: 149 (0.07%)
Canadian: 142 (0.06%)
Palestinian: 141 (0.06%)
Dutch West Indian: 140 (0.06%)
Finnish: 135 (0.06%)
Lithuanian: 110 (0.05%)
Arab: 107 (0.05%)
Armenian: 99 (0.05%)
Iraqi: 99 (0.05%)
Ghanaian: 90 (0.04%)
Icelander: 81 (0.04%)
Swiss: 73 (0.03%)
Croatian: 71 (0.03%)
Israeli: 71 (0.03%)
Ethiopian: 70 (0.03%)
Cajun: 66 (0.03%)
Ugandan: 60 (0.03%)
Australian: 49 (0.02%)
Belizean: 49 (0.02%)
Bahamian: 43 (0.02%)
Slavic: 39 (0.02%)
Jordanian: 39 (0.02%)
Czechoslovakian: 39 (0.02%)
Slovene: 37 (0.02%)
Austrian: 36 (0.02%)
Liberian: 36 (0.02%)
Belgian: 28 (0.01%)
Slovak: 28 (0.01%)
Barbadian: 27 (0.01%)
Sudanese: 20 (0.01%)
Basque: 19 (0.01%)
Pennsylvania German: 19 (0.01%)
Trinidadian and Tobagonian: 11 (0.01%)
Zimbabwean: 11 (0.01%)
Most common places of birth for foreign-born residents (%): Mexico Tulsa:
46.6% (21,315)Oklahoma:
42.4% (103,425)
Guatemala Tulsa:
4.7% (2,161)Oklahoma:
4.2% (10,287)
Burma (Myanmar) Tulsa:
3.3% (1,527)Oklahoma:
1.7% (4,135)
India Tulsa:
3.2% (1,452)Oklahoma:
4.1% (10,034)
Vietnam Tulsa:
3.0% (1,357)Oklahoma:
5.6% (13,699)
Honduras Tulsa:
3.0% (1,351)Oklahoma:
1.7% (4,239)
China, excluding Hong Kong and Taiwan Tulsa:
2.1% (978)Oklahoma:
3.2% (7,698)
Venezuela Tulsa:
1.8% (812)Oklahoma:
1.2% (3,010)
El Salvador Tulsa:
1.8% (804)Oklahoma:
1.6% (3,824)
Place of birth for U.S.-born residents:
This state: 230,067Other state: 128,655Northeast: 10,375Midwest: 40,199South: 46,962West: 31,119 83.1% of Tulsa residents lived in the same house 1 years ago.
Out of people who lived in different houses, 38.9% lived in this county.
Out of people who lived in different counties, 46.6% lived in Oklahoma.
Tulsa:
83.1%State average:
85.5%
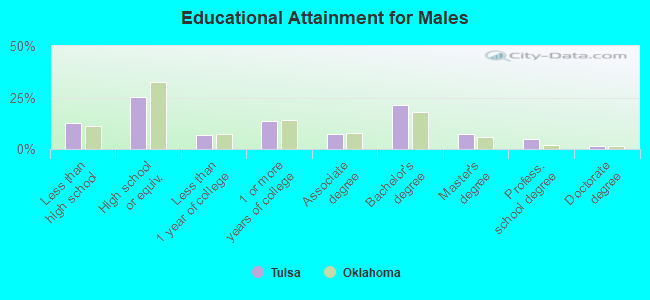
Education attainment for males 25 years and older:
No schooling: 3,267Nursery to 4th grade: 1,1345th and 6th grade: 2,7907th and 8th grade: 1,1339th grade: 1,72410th grade: 1,63911th grade: 2,72012th grade, no diploma: 1,926High school graduate (or equivalency): 33,210Less than 1 year of college: 8,810Some college more than 1 year, no degree: 17,649Associate degree: 9,520Bachelor's degree: 28,220Master's degree: 9,729Professional school degree: 6,377Doctorate degree: 1,724
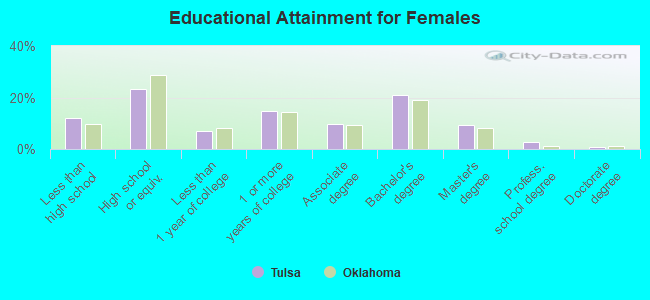
Education attainment for females 25 years and older:
No schooling: 2,785Nursery to 4th grade: 6575th and 6th grade: 2,2687th and 8th grade: 1,0119th grade: 2,20310th grade: 2,22011th grade: 3,82512th grade, no diploma: 2,010High school graduate (or equivalency): 33,118Less than 1 year of college: 9,680Some college more than 1 year, no degree: 20,943Associate degree: 13,568Bachelor's degree: 29,669Master's degree: 13,017Professional school degree: 3,938Doctorate degree: 1,174
Housing units in structures:
One, detached: 117,584One, attached: 6,071Two: 4,0643 or 4: 8,5815 to 9: 16,24010 to 19: 15,27520 to 49: 9,87050 or more: 14,303Mobile homes: 2,302Boats, RVs, vans, etc.: 251Median worth of mobile homes: $32,100
Housing units lacking complete plumbing facilities in 2022: 1.6%Housing units lacking complete kitchen facilities in 2022: 2.3%House/condo owner moved in on average 11 years ago
Renter moved in on average 2 years ago
Private vs. public school enrollment:
Students in private schools in grades 1 to 8 (elementary and middle school): 7,092 Students in private schools in grades 9 to 12 (high school): 3,249 Students in private undergraduate colleges: 7,957