Tillmans Corner, AL (Alabama) Houses and Residents
| Tillmans Corner: | $153,135 |
| Alabama: | $200,900 |
Mean price in 2022:
Detached houses: $193,143
Here: $193,143 State: $273,076 Townhouses or other attached units: $131,994
Here: $131,994 State: $222,857 Mobile homes: $56,079
Here: $56,079 State: $77,780
Total population: 17,398 (Urban population: 15,574, Rural population: 11 (all nonfarm))
Houses: 7,488 (6,765 occupied: 4,180 owner occupied, 2,662 renter occupied)
| % of renters here: | 39% |
| State: | 30% |
Housing density: 428 houses/condos per square mile
Median price asked for vacant for-sale houses and condos in 2022: $400,935.
Median contract rent in 2022: $665 (lower quartile is $496, upper quartile is $850)
Median rent asked for vacant for-rent units in 2022: $752
Median gross rent in Tillmans Corner, AL in 2022: $817
Housing units in Tillmans Corner with a mortgage: 2,441 (130 second mortgage, 0 home equity loan, 143 both second mortgage and home equity loan)
Houses without a mortgage: 139
Median household income for houses/condos with a mortgage: $82,029
Median household income for apartments without a mortgage: $48,804
Median monthly housing costs: $804
Compare current foreclosures near Tillmans Corner, AL:
| Photo | Address | Area | Beds / Baths | Price | Details |
|---|---|---|---|---|---|

|
#1
Joyce Ave N
Eight Mile, AL 36613
|
1,400 sq. feet
|
2 baths 3 beds |
$34,900
|
show details |

|
#2
Meaher Ave
Mobile, AL 36610
|
1,601 sq. feet
|
1 baths - beds |
$9,900
|
show details |

|
#3
Heaton Dr
Theodore, AL 36582
|
1,728 sq. feet
|
2 baths 3 beds |
show details | |

|
#4
Charles St
Mobile, AL 36604
|
2,082 sq. feet
|
2 baths 3 beds |
show details | |

|
#5
Williams St
Mobile, AL 36606
|
1,421 sq. feet
|
1 baths 3 beds |
show details | |

|
#6
Imperial Dr
Mobile, AL 36608
|
1,973 sq. feet
|
2 baths 4 beds |
show details | |

|
#7
Browder Dr
Theodore, AL 36582
|
1,995 sq. feet
|
2 baths 3 beds |
show details | |

|
#8
Autumndale Dr
Mobile, AL 36618
|
1,714 sq. feet
|
2 baths 4 beds |
show details | |

|
#9
Ormerd Rd
Eight Mile, AL 36613
|
1,431 sq. feet
|
2 baths 3 beds |
show details | |

|
#10
Woodard Ave
Mobile, AL 36610
|
1,742 sq. feet
|
1 baths 4 beds |
show details |
| Photo | Address | Area | Beds / Baths | Price | Details |
|---|---|---|---|---|---|

|
#11
Woodside Dr N
Theodore, AL 36582
|
1,822 sq. feet
|
2 baths 3 beds |
show details | |

|
#12
S Chadwick Dr
Mobile, AL 36606
|
1,928 sq. feet
|
1 baths 3 beds |
show details | |

|
#13
Peyton Dr E
Mobile, AL 36695
|
1,893 sq. feet
|
2 baths 3 beds |
show details | |

|
#14
Dawn Ct
Mobile, AL 36695
|
1,398 sq. feet
|
2 baths 3 beds |
show details | |

|
#15
Wulff Rd E
Semmes, AL 36575
|
1,536 sq. feet
|
2 baths 3 beds |
show details | |

|
#16
Penn Dr
Semmes, AL 36575
|
- sq. feet
|
2 baths 3 beds |
show details | |

|
#17
Aldock Rd
Eight Mile, AL 36613
|
1,392 sq. feet
|
1 baths 3 beds |
show details | |

|
#18
Leven Ct
Mobile, AL 36695
|
2,590 sq. feet
|
2 baths 5 beds |
show details | |

|
#19
Dalewood Dr
Mobile, AL 36608
|
2,158 sq. feet
|
1 baths 3 beds |
show details | |

|
#20
Middleburg Ct
Mobile, AL 36608
|
3,430 sq. feet
|
2 baths 5 beds |
show details |
| Photo | Address | Area | Beds / Baths | Price | Details |
|---|---|---|---|---|---|

|
#21
Thrift St
Mobile, AL 36609
|
1,744 sq. feet
|
2 baths 3 beds |
show details | |

|
#22
Gray Oaks Dr
Theodore, AL 36582
|
1,659 sq. feet
|
2 baths 3 beds |
show details | |

|
#23
Viewpoint Rd
Eight Mile, AL 36613
|
1,848 sq. feet
|
2 baths 3 beds |
show details | |

|
#24
N Fleetwood Dr
Mobile, AL 36605
|
1,025 sq. feet
|
1 baths 3 beds |
show details | |

|
#25
Wards Ln
Semmes, AL 36575
|
1,075 sq. feet
|
2 baths 3 beds |
show details | |

|
#26
Howells Ferry Rd
Semmes, AL 36575
|
1,849 sq. feet
|
2 baths 4 beds |
show details | |

|
#27
Carstens Ct
Mobile, AL 36617
|
1,531 sq. feet
|
2 baths 3 beds |
show details | |

|
#28
Steward Ct
Grand Bay, AL 36541
|
2,151 sq. feet
|
2 baths 3 beds |
show details | |

|
#29
N Lafayette St
Mobile, AL 36603
|
3,186 sq. feet
|
2 baths 4 beds |
show details | |

|
#30
Saint Stephens Ct
Mobile, AL 36617
|
1,350 sq. feet
|
2 baths 4 beds |
show details |
| Photo | Address | Area | Beds / Baths | Price | Details |
|---|---|---|---|---|---|

|
#31
Oak Point Cir
Mobile, AL 36608
|
1,356 sq. feet
|
2 baths 3 beds |
show details | |

|
#32
Holleman Dr
Mobile, AL 36618
|
1,196 sq. feet
|
2 baths 3 beds |
show details | |

|
#33
Farnell Ln
Mobile, AL 36606
|
1,688 sq. feet
|
2 baths 3 beds |
show details | |

|
#34
Pine Dr
Grand Bay, AL 36541
|
1,287 sq. feet
|
2 baths 3 beds |
show details | |

|
#35
La Pine Dr
Mobile, AL 36618
|
1,560 sq. feet
|
2 baths 3 beds |
show details | |

|
#36
Byronell Dr N
Mobile, AL 36693
|
- sq. feet
|
3 baths 3 beds |
show details | |

|
#37
Mcdonald Rd
Theodore, AL 36582
|
1,218 sq. feet
|
1 baths 3 beds |
show details | |

|
#38
Mitchell Dr
Irvington, AL 36544
|
- sq. feet
|
2 baths 4 beds |
show details | |

|
#39
N Quail Ridge Ln
Grand Bay, AL 36541
|
1,216 sq. feet
|
2 baths 3 beds |
show details | |

|
#40
Vista View Dr
Mobile, AL 36608
|
1,264 sq. feet
|
2 baths 3 beds |
show details |
| Photo | Address | Area | Beds / Baths | Price | Details |
|---|---|---|---|---|---|

|
#41
Joe Carl Rd S
Theodore, AL 36582
|
912 sq. feet
|
2 baths 2 beds |
show details | |

|
#42
King Arthur Dr
Grand Bay, AL 36541
|
1,247 sq. feet
|
2 baths 3 beds |
show details | |

|
#43
Shay Ct
Mobile, AL 36695
|
2,785 sq. feet
|
3 baths 4 beds |
show details | |

|
#44
Emogene St
Mobile, AL 36606
|
1,402 sq. feet
|
1 baths 3 beds |
show details | |

|
#45
Diane Dr
Mobile, AL 36618
|
1,121 sq. feet
|
1 baths 3 beds |
show details | |

|
#46
Clarendon Dr
Mobile, AL 36619
|
2,409 sq. feet
|
2 baths 5 beds |
show details | |

|
#47
Grand Blvd
Mobile, AL 36611
|
1,400 sq. feet
|
2 baths 3 beds |
show details | |

|
#48
Old Pascagoula Rd
Theodore, AL 36582
|
1,442 sq. feet
|
2 baths 3 beds |
show details | |

|
#49
Princeton Woods Dr S
Mobile, AL 36618
|
1,524 sq. feet
|
2 baths 3 beds |
show details | |

|
Check over 1 million property listings on Foreclosure.com!
|
browse all offers | |||


 | Downtown Mobile Updates (1630 replies) |
| Mobile-Bay area Development and Projects (1023 replies) |
| Mobile Area Populations (74 replies) |
| Moving to the area, Where? (34 replies) |
| Tillman Corners or Theodore (8 replies) |
| Moving in a month to Mobile. (2 replies) |

Median year apartment built: 1979
Household type by relationship:
Households: 17,910- Male householders: 3,300 (936 living alone), Female householders: 3,375 (781 living alone)
2,834 spouses (2,834 opposite-sex spouses), 558 unmarried partners, (541 opposite-sex unmarried partners), 6,099 children (5,499 natural, 219 adopted, 380 stepchildren), 483 grandchildren, 389 brothers or sisters, 154 parents, 0 foster children, 131 other relatives, 557 non-relatives
- In group quarters: 26
Size of family households: 2,180 2-persons, 1,286 3-persons, 797 4-persons, 247 5-persons, 90 6-persons, 37 7-or-more-persons.
Size of nonfamily households: 1,832 1-person, 222 2-persons, 65 3-persons, 13 5-persons, 18 6-persons.
1,901 married couples with children.
2,400 single-parent households (757 men, 1,643 women).
91.3% of residents of Tillmans Corner speak English at home.
3.8% of residents speak Spanish at home (73% speak English very well, 17% speak English well, 10% speak English not well).
0.7% of residents speak other Indo-European language at home (55% speak English very well, 45% speak English well).
4.4% of residents speak Asian or Pacific Island language at home (69% speak English very well, 15% speak English well, 16% speak English not well).
Foreign born population: 590 (3.3%)
(83.9% of them are naturalized citizens)
| Here: | 6.2 |
| State: | 6.5 |
| Here: | 4.7 |
| State: | 4.7 |

- Bedrooms in owner-occupied houses and condos in Tillmans Corner, Alabama
- 0no bedroom
- 711 bedroom
- 3212 bedrooms
- 2,8693 bedrooms
- 7994 bedrooms
- 1205+ bedrooms

- Bedrooms in renter-occupied apartments in Tillmans Corner, Alabama
- 22no bedroom
- 4441 bedroom
- 1,0492 bedrooms
- 1,0333 bedrooms
- 1134 bedrooms
- 05+ bedrooms

- Cars and other vehicles available in Tillmans Corner in owner-occupied houses/condos
- 24no vehicle
- 8431 vehicle
- 1,7452 vehicles
- 1,2713 vehicles
- 2144 vehicles
- 835+ vehicles

- Cars and other vehicles available in Tillmans Corner in renter-occupied apartments
- 280no vehicle
- 1,5751 vehicle
- 5102 vehicles
- 2533 vehicles
- 04 vehicles
- 445+ vehicles

- Rooms in owner-occupied houses in Tillmans Corner, Alabama
- 01 room
- 222 rooms
- 573 rooms
- 1954 rooms
- 1,0405 rooms
- 1,1046 rooms
- 9437 rooms
- 4568 rooms
- 3629+ rooms

- Rooms in renter-occupied apartments in Tillmans Corner, Alabama
- 121 room
- 102 rooms
- 3513 rooms
- 7474 rooms
- 9395 rooms
- 2886 rooms
- 1977 rooms
- 1108 rooms
- 79+ rooms


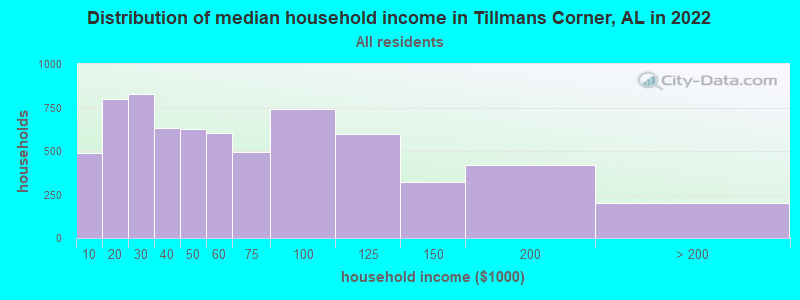
Tillmans Corner, AL household income distribution

- 487Less than $10,000
- 797$10,000 to $19,999
- 829$20,000 to $29,999
- 631$30,000 to $39,999
- 629$40,000 to $49,999
- 603$50,000 to $59,999
- 492$60,000 to $74,999
- 744$75,000 to $99,999
- 599$100,000 to $124,999
- 319$125,000 to $149,999
- 417$150,000 to $199,999
- 204$200,000 or more
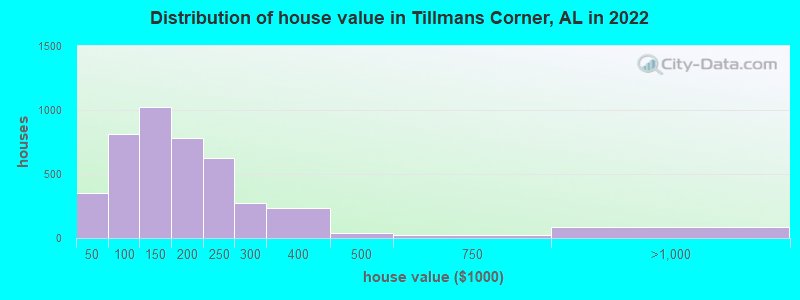
Home value of owner - occupied houses in 2022 in Tillmans Corner, AL
-
- 52Less than $10,000
- 20$10,000 to $14,999
- 29$15,000 to $19,999
- 43$20,000 to $24,999
- 45$35,000 to $39,999
- 159$40,000 to $49,999
- 59$50,000 to $59,999
- 94$60,000 to $69,999
- 74$70,000 to $79,999
- 207$80,000 to $89,999
- 216$90,000 to $99,999
- 576$100,000 to $124,999
- 449$125,000 to $149,999
- 622$150,000 to $174,999
- 156$175,000 to $199,999
- 621$200,000 to $249,999
- 273$250,000 to $299,999
- 233$300,000 to $399,999
- 40$400,000 to $499,999
- 22$500,000 to $749,999
- 72$750,000 to $999,999
- 12$1,000,000 to $1,499,999
Rent paid by renters in 2022 in Tillmans Corner, AL
-
- 105$100 to $149
- 80$150 to $199
- 144$200 to $249
- 69$300 to $349
- 123$350 to $399
- 81$400 to $449
- 143$500 to $549
- 189$550 to $599
- 206$600 to $649
- 239$650 to $699
- 109$700 to $749
- 196$750 to $799
- 241$800 to $899
- 259$900 to $999
- 123$1,000 to $1,249
- 50$1,250 to $1,499
- 7$1,500 to $1,999
- 50$2,000 to $2,499
- 80No cash rent


Percentage of workers working in this county: 92.6%
Number of people working at home: 553 (7.8% of all workers)
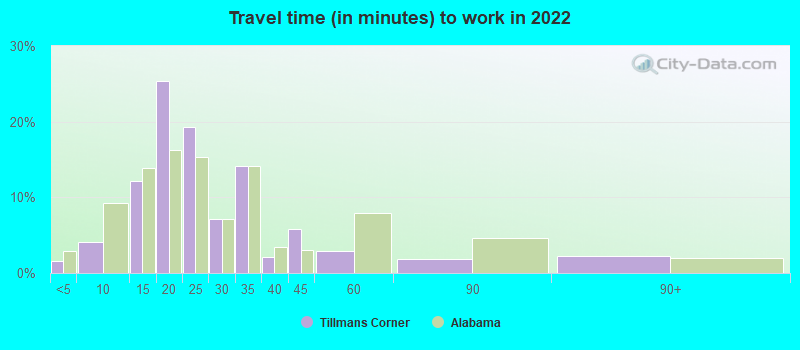
Travel time to work (commute)
- Less than 5 minutes: 39
- 5 to 9 minutes: 304
- 10 to 14 minutes: 537
- 15 to 19 minutes: 1,536
- 20 to 24 minutes: 1,281
- 25 to 29 minutes: 663
- 30 to 34 minutes: 957
- 35 to 39 minutes: 105
- 40 to 44 minutes: 248
- 45 to 59 minutes: 240
- 60 to 89 minutes: 196
- 90 or more minutes: 251

Means of transportation to work:
- Drove a car alone: 2,353 (74.1%)
- Carpooled: 321 (10.1%)
- Walked: 65 (2.0%)
- Worked at home: 509 (16.0%)

- Unemployment by race in 2022
- Unemployment rate for White non-Hispanic residents
- 5.7%Males
- 9.2%Females
- Unemployment rate for Black residents
- 30.7%Males
- 5.5%Females
- Unemployment rate for other race residents
- 24.9%Males
- Unemployment rate for two or more race residents
- 14.7%Females
- Unemployment rate for Hispanic or Latino residents
- 14.6%Males
- 25.4%Females

- Year of entry for the foreign-born population in Tillmans Corner, Alabama
- 1292010 or later
- 1222000 to 2009
- 1951990 to 1999
- 261980 to 1989
- 381970 to 1979
- 83Before 1970

First ancestries reported:
- American: 1,345 (17.2%)
- English: 680 (8.7%)
- Irish: 485 (6.2%)
- German: 457 (5.8%)
- Italian: 218 (2.8%)
- Scottish: 176 (2.3%)
- European: 135 (1.7%)
- French: 127 (1.6%)
- Greek: 105 (1.3%)
- Danish: 104 (1.3%)
- Dutch: 89 (1.1%)
- Scotch-Irish: 65 (0.8%)
- Belizean: 65 (0.8%)
- African: 50 (0.6%)
- Slovak: 31 (0.4%)
- British: 22 (0.3%)
- French Canadian: 22 (0.3%)
- Czechoslovakian: 14 (0.2%)
- Croatian: 12 (0.2%)
- Portuguese: 8 (0.1%)
Most common places of birth for foreign-born residents (%):
| Tillmans Corner: | 30.6% (187) |
| Alabama: | 3.6% (6,414) |
| Tillmans Corner: | 14.7% (90) |
| Alabama: | 26.4% (46,832) |
| Tillmans Corner: | 8.8% (54) |
| Alabama: | 1.9% (3,447) |
| Tillmans Corner: | 6.7% (41) |
| Alabama: | 3.9% (6,831) |
| Tillmans Corner: | 6.5% (40) |
| Alabama: | 5.5% (9,672) |
| Tillmans Corner: | 5.9% (36) |
| Alabama: | 0.4% (674) |
| Tillmans Corner: | 4.4% (27) |
| Alabama: | 0.1% (100) |
| Tillmans Corner: | 3.8% (23) |
| Alabama: | 2.9% (5,154) |
| Tillmans Corner: | 3.8% (23) |
| Alabama: | 1.1% (1,877) |
| Tillmans Corner: | 3.6% (22) |
| Alabama: | 0.1% (261) |
| Tillmans Corner: | 3.3% (20) |
| Alabama: | 0.3% (515) |
| Tillmans Corner: | 2.6% (16) |
| Alabama: | 0.7% (1,231) |
| Tillmans Corner: | 2.3% (14) |
| Alabama: | 1.3% (2,382) |
| Tillmans Corner: | 1.6% (10) |
| Alabama: | 0.7% (1,182) |
Place of birth for U.S.-born residents:
- This state: 12,510
- Other state: 4,589
- Northeast: 677
- Midwest: 882
- South: 2,472
- West: 486
92.3% of Tillmans Corner residents lived in the same house 1 years ago.
Out of people who lived in different houses, 35.6% lived in this county.
Out of people who lived in different counties, 37.7% lived in Alabama.
| Tillmans Corner: | 92.3% |
| State average: | 87.6% |
Education attainment for males 25 years and older:
- No schooling: 112
- Nursery to 4th grade: 36
- 5th and 6th grade: 126
- 7th and 8th grade: 52
- 9th grade: 197
- 10th grade: 82
- 11th grade: 144
- 12th grade, no diploma: 115
- High school graduate (or equivalency): 2,495
- Less than 1 year of college: 381
- Some college more than 1 year, no degree: 901
- Associate degree: 685
- Bachelor's degree: 444
- Master's degree: 221
- Professional school degree: 0
- Doctorate degree: 22

Education attainment for females 25 years and older:
- No schooling: 60
- Nursery to 4th grade: 0
- 5th and 6th grade: 0
- 7th and 8th grade: 31
- 9th grade: 162
- 10th grade: 144
- 11th grade: 75
- 12th grade, no diploma: 68
- High school graduate (or equivalency): 1,705
- Less than 1 year of college: 432
- Some college more than 1 year, no degree: 1,206
- Associate degree: 818
- Bachelor's degree: 563
- Master's degree: 292
- Professional school degree: 18
- Doctorate degree: 0


Housing units in structures:
- One, detached: 5,114
- One, attached: 12
- 3 or 4: 107
- 5 to 9: 468
- 10 to 19: 384
- 20 to 49: 56
- 50 or more: 231
- Mobile homes: 1,072
- Boats, RVs, vans, etc.: 39
Median worth of mobile homes: $33,938
Housing units lacking complete kitchen facilities in 2022: 3.0%
House/condo owner moved in on average 12 years ago
Renter moved in on average 5 years ago

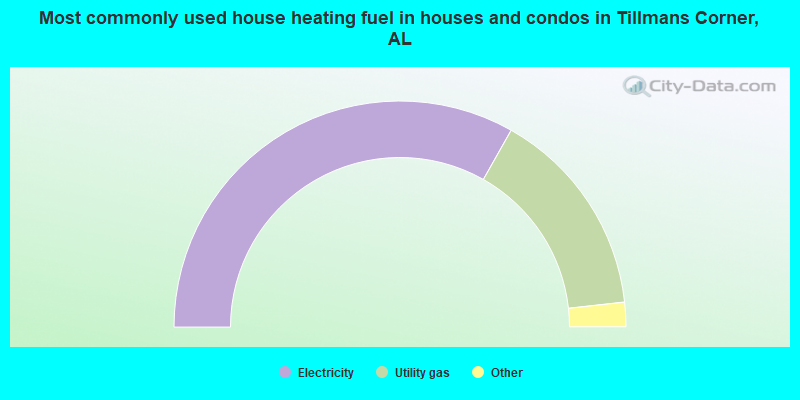
- 66.4%Electricity
- 30.1%Utility gas
- 2.5%Wood
- 1.0%Bottled, tank, or LP gas
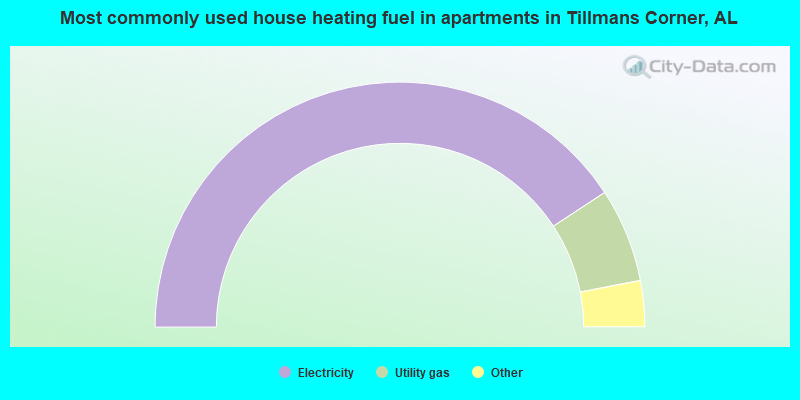
- 81.6%Electricity
- 12.4%Utility gas
- 3.6%Bottled, tank, or LP gas
- 1.4%Other fuel
- 1.1%No fuel used
Private vs. public school enrollment:
| Here: | 10.7% |
| Alabama: | 14.7% |
| Here: | 10.4% |
| Alabama: | 16.3% |
| Here: | 15.0% |
| Alabama: | 14.6% |


