Syracuse, NY (New York) Houses and Residents
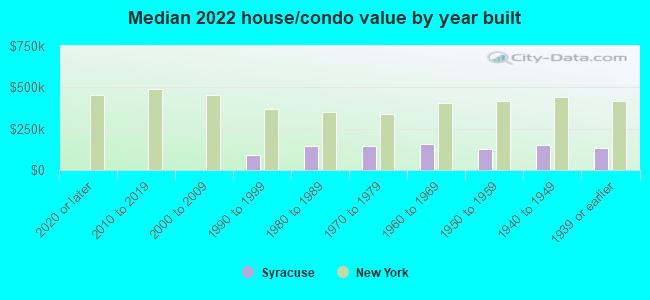
| Syracuse: | $135,700 |
| New York: | $400,400 |
Mean price in 2022:
Detached houses: $148,726
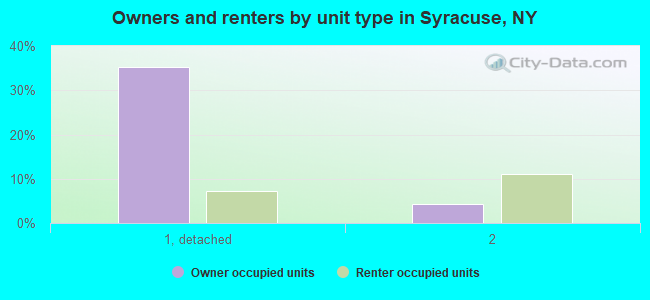
Here: $148,726 State: $476,719 Townhouses or other attached units: $212,400
Here: $212,400 State: $699,270 In 2-unit structures: $132,606
Here: $132,606 State: $713,077 In 3-to-4-unit structures: $1,114,000
Here: $1,114,000 State: $764,568 In 5-or-more-unit structures: $122,940
Here: $122,940 State: $912,009 Mobile homes: $73,126
Here: $73,126 State: $88,925
Total population: 144,263 (All urban)
Houses: 66,350 (60,078 occupied: 25,967 owner occupied, 34,111 renter occupied)
| % of renters here: | 57% |
| State: | 46% |
Housing density: 2,644 houses/condos per square mile
Median price asked for vacant for-sale houses and condos in 2022: $74,501.
Median contract rent in 2022: $775 (lower quartile is $561, upper quartile is $1,014)
Median rent asked for vacant for-rent units in 2022: $386
Median gross rent in Syracuse, NY in 2022: $931
Housing units in Syracuse with a mortgage: 16,066 (2,190 second mortgage, 0 home equity loan, 1,645 both second mortgage and home equity loan)
Houses without a mortgage: 530
Median household income for houses/condos with a mortgage: $67,325
Median household income for apartments without a mortgage: $54,544
Median monthly housing costs: $915
Compare current foreclosures in Syracuse, NY:
| Photo | Address | Area | Beds / Baths | Price | Details |
|---|---|---|---|---|---|

|
#1
Spring St
Syracuse, NY 13208
|
2,244 sq. feet
|
2 baths 4 beds |
$219,900
|
show details |

|
#2
Valley View Dr
Syracuse, NY 13207
|
1,092 sq. feet
|
2 baths 3 beds |
show details | |

|
#3
Cambridge St
Syracuse, NY 13210
|
2,560 sq. feet
|
2 baths 4 beds |
show details | |

|
#4
Van Mara Dr
Syracuse, NY 13212
|
1,080 sq. feet
|
1 baths 4 beds |
show details | |

|
#5
S Midler Ave
Syracuse, NY 13206
|
1,002 sq. feet
|
1 baths 3 beds |
show details | |

|
#6
Tower Ave
Syracuse, NY 13206
|
1,200 sq. feet
|
1 baths 3 beds |
show details | |

|
#7
Earl Ave
Syracuse, NY 13211
|
874 sq. feet
|
1 baths 3 beds |
show details | |

|
#8
Palmer Ave
Syracuse, NY 13207
|
1,144 sq. feet
|
1 baths 3 beds |
show details | |

|
#9
Midland Ave
Syracuse, NY 13205
|
1,260 sq. feet
|
2 baths 3 beds |
show details | |

|
#10
Cheney St
Syracuse, NY 13207
|
1,728 sq. feet
|
2 baths 4 beds |
show details |
| Photo | Address | Area | Beds / Baths | Price | Details |
|---|---|---|---|---|---|

|
#11
Brattle Rd
Syracuse, NY 13203
|
1,086 sq. feet
|
2 baths 2 beds |
show details | |

|
#12
E Colvin St
Syracuse, NY 13210
|
1,512 sq. feet
|
1 baths 3 beds |
show details | |

|
#13
Mildred Ave
Syracuse, NY 13206
|
1,476 sq. feet
|
1 baths 3 beds |
show details | |

|
#14
Westmoreland Ave
Syracuse, NY 13210
|
1,344 sq. feet
|
1 baths 3 beds |
show details | |

|
#15
1st St
Syracuse, NY 13209
|
1,512 sq. feet
|
3 baths 4 beds |
show details | |

|
#16
Hartson St
Syracuse, NY 13204
|
1,039 sq. feet
|
1 baths 2 beds |
show details | |

|
#17
Park St
Syracuse, NY 13203
|
1,365 sq. feet
|
1 baths 2 beds |
show details | |

|
#18
Helen St
Syracuse, NY 13203
|
1,814 sq. feet
|
2 baths 5 beds |
show details | |

|
#19
Ontario Ave
Syracuse, NY 13209
|
1,680 sq. feet
|
2 baths 3 beds |
show details | |

|
#20
Argonne Dr
Syracuse, NY 13207
|
1,525 sq. feet
|
2 baths 3 beds |
show details |
| Photo | Address | Area | Beds / Baths | Price | Details |
|---|---|---|---|---|---|

|
#21
Charmouth Dr
Syracuse, NY 13207
|
1,164 sq. feet
|
2 baths 3 beds |
show details | |

|
#22
Oakdale Dr
Syracuse, NY 13207
|
1,344 sq. feet
|
1 baths 3 beds |
show details | |

|
#23
Hopper Rd
Syracuse, NY 13207
|
1,198 sq. feet
|
2 baths 2 beds |
show details | |

|
#24
Marshia Ave
Syracuse, NY 13212
|
932 sq. feet
|
1 baths 3 beds |
show details | |

|
#25
Bear Rd
Syracuse, NY 13212
|
1,300 sq. feet
|
1 baths 2 beds |
show details | |

|
#26
Lydell St
Syracuse, NY 13204
|
1,478 sq. feet
|
1 baths 3 beds |
show details | |

|
#27
Dolshire Dr
Syracuse, NY 13212
|
1,980 sq. feet
|
2 baths 3 beds |
show details | |

|
#28
Spaulding Ave
Syracuse, NY 13205
|
1,260 sq. feet
|
2 baths 3 beds |
show details | |

|
#29
W Colvin St
Syracuse, NY 13207
|
1,344 sq. feet
|
1 baths 4 beds |
show details | |

|
#30
Anderson Ave
Syracuse, NY 13205
|
1,216 sq. feet
|
2 baths 2 beds |
show details |
| Photo | Address | Area | Beds / Baths | Price | Details |
|---|---|---|---|---|---|

|
#31
Markland Ave
Syracuse, NY 13207
|
1,853 sq. feet
|
2 baths 3 beds |
show details | |

|
#32
Hastings Pl
Syracuse, NY 13206
|
1,452 sq. feet
|
2 baths 3 beds |
show details | |

|
#33
Court St
Syracuse, NY 13208
|
1,312 sq. feet
|
1 baths 2 beds |
show details | |

|
#34
Crystal Dr
Syracuse, NY 13212
|
1,406 sq. feet
|
1 baths 2 beds |
show details | |

|
#35
Crystal Dr
Syracuse, NY 13212
|
1,166 sq. feet
|
1 baths 2 beds |
show details | |

|
#36
Newcastle Rd
Syracuse, NY 13219
|
1,256 sq. feet
|
1 baths 3 beds |
show details | |

|
#37
Millen Dr
Syracuse, NY 13212
|
1,096 sq. feet
|
1 baths 3 beds |
show details | |

|
#38
Ashdale Ave
Syracuse, NY 13206
|
1,152 sq. feet
|
2 baths 2 beds |
show details | |

|
#39
Walters Rd
Syracuse, NY 13209
|
2,016 sq. feet
|
1 baths 4 beds |
show details | |

|
#40
Matty Ave
Syracuse, NY 13211
|
1,560 sq. feet
|
2 baths 3 beds |
show details |
| Photo | Address | Area | Beds / Baths | Price | Details |
|---|---|---|---|---|---|

|
#41
Gertrude Ave
Syracuse, NY 13209
|
2,205 sq. feet
|
2 baths 4 beds |
show details | |

|
#42
Highridge Dr
Syracuse, NY 13215
|
1,848 sq. feet
|
2 baths 3 beds |
show details | |

|
#43
Allen St
Syracuse, NY 13210
|
2,000 sq. feet
|
2 baths 4 beds |
show details | |

|
#44
Bear St
Syracuse, NY 13208
|
988 sq. feet
|
1 baths 3 beds |
show details | |

|
#45
Fage Ave
Syracuse, NY 13205
|
1,128 sq. feet
|
1 baths 3 beds |
show details | |

|
#46
Standish Dr
Syracuse, NY 13212
|
1,650 sq. feet
|
3 baths 4 beds |
show details | |

|
#47
Brittany Ln
Syracuse, NY 13215
|
3,736 sq. feet
|
5 baths 6 beds |
show details | |

|
#48
E Colvin St
Syracuse, NY 13210
|
1,008 sq. feet
|
1 baths 3 beds |
show details | |

|
#49
N State St
Syracuse, NY 13208
|
1,273 sq. feet
|
1 baths 3 beds |
show details | |

|
Check over 1 million property listings on Foreclosure.com!
|
browse all offers | |||

Latest news about housing in Syracuse, NY collected exclusively by city-data.com from local newspapers, TV, and radio stations


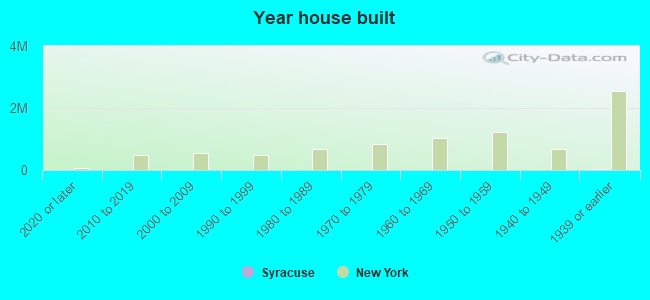
Median year apartment built: 1960
Household type by relationship:
Households: 144,459- Male householders: 27,702 (13,455 living alone), Female householders: 32,376 (13,786 living alone)
14,123 spouses (13,586 opposite-sex spouses), 6,629 unmarried partners, (6,217 opposite-sex unmarried partners), 32,817 children (30,340 natural, 1,211 adopted, 1,266 stepchildren), 4,000 grandchildren, 1,352 brothers or sisters, 732 parents, 120 foster children, 943 other relatives, 4,897 non-relatives
- In group quarters: 18,768
Size of family households: 11,848 2-persons, 5,399 3-persons, 4,830 4-persons, 2,248 5-persons, 752 6-persons, 842 7-or-more-persons.
Size of nonfamily households: 27,241 1-person, 5,787 2-persons, 570 3-persons, 561 4-persons.
11,061 married couples with children.
14,141 single-parent households (2,373 men, 11,768 women).
81.2% of residents of Syracuse speak English at home.
6.2% of residents speak Spanish at home (71% speak English very well, 17% speak English well, 8% speak English not well, 3% don't speak English at all).
3.4% of residents speak other Indo-European language at home (57% speak English very well, 28% speak English well, 11% speak English not well, 3% don't speak English at all).
5.1% of residents speak Asian or Pacific Island language at home (56% speak English very well, 32% speak English well, 7% speak English not well, 5% don't speak English at all).
4.8% of residents speak other language at home (57% speak English very well, 25% speak English well, 13% speak English not well, 4% don't speak English at all).
Foreign born population: 14,960 (10.4%)
(47.6% of them are naturalized citizens)
| Here: | 6.8 |
| State: | 6.3 |
| Here: | 4.1 |
| State: | 3.8 |
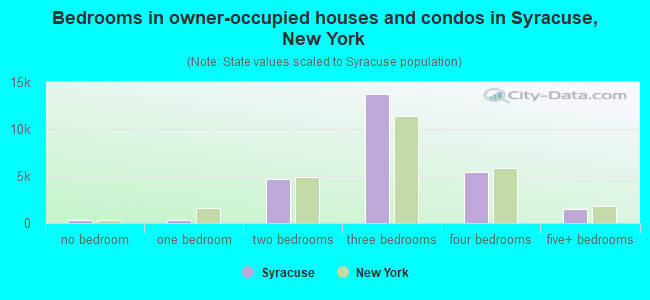
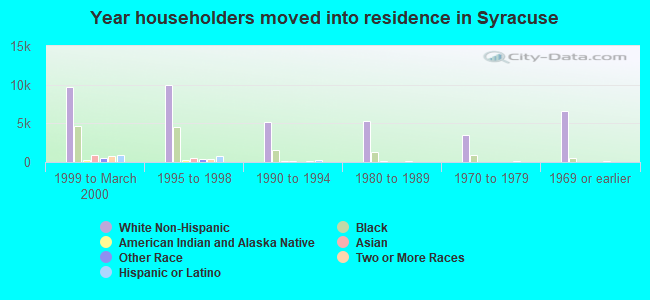
- Bedrooms in owner-occupied houses and condos in Syracuse, New York
- 317no bedroom
- 3091 bedroom
- 4,6972 bedrooms
- 13,6943 bedrooms
- 5,4674 bedrooms
- 1,4835+ bedrooms
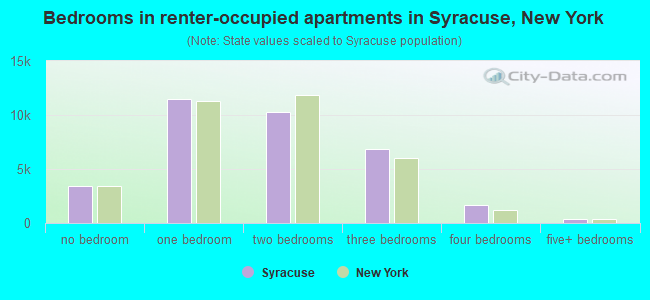
- Bedrooms in renter-occupied apartments in Syracuse, New York
- 3,391no bedroom
- 11,4871 bedroom
- 10,3102 bedrooms
- 6,8673 bedrooms
- 1,6984 bedrooms
- 3585+ bedrooms
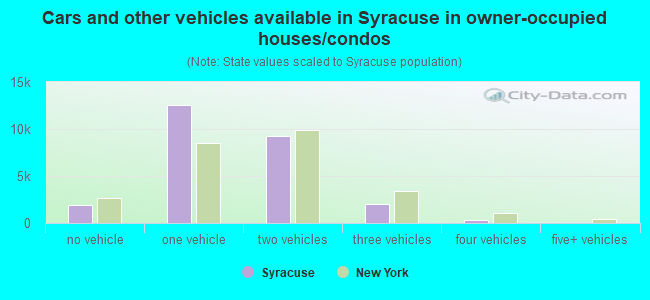
- Cars and other vehicles available in Syracuse in owner-occupied houses/condos
- 1,966no vehicle
- 12,5151 vehicle
- 9,2322 vehicles
- 1,9803 vehicles
- 2744 vehicles
- 05+ vehicles
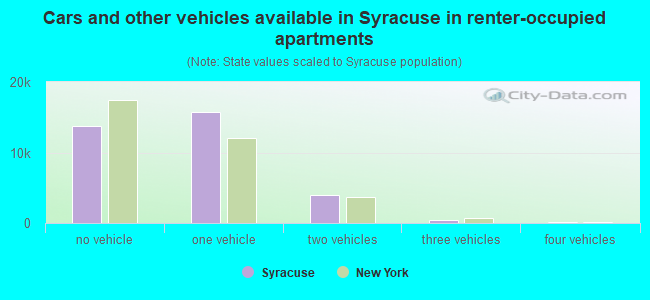
- Cars and other vehicles available in Syracuse in renter-occupied apartments
- 13,737no vehicle
- 15,8021 vehicle
- 3,9022 vehicles
- 4813 vehicles
- 1194 vehicles
- 705+ vehicles
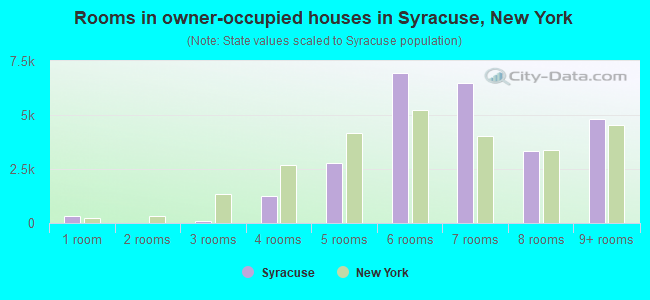
- Rooms in owner-occupied houses in Syracuse, New York
- 3171 room
- 02 rooms
- 903 rooms
- 1,2304 rooms
- 2,7675 rooms
- 6,9336 rooms
- 6,4967 rooms
- 3,3198 rooms
- 4,8159+ rooms
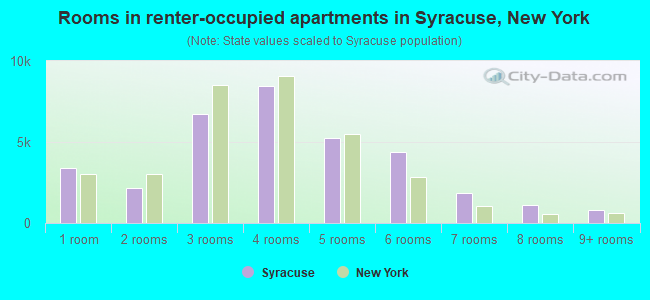
- Rooms in renter-occupied apartments in Syracuse, New York
- 3,3911 room
- 2,1432 rooms
- 6,7443 rooms
- 8,4774 rooms
- 5,2665 rooms
- 4,3686 rooms
- 1,8457 rooms
- 1,0988 rooms
- 7799+ rooms
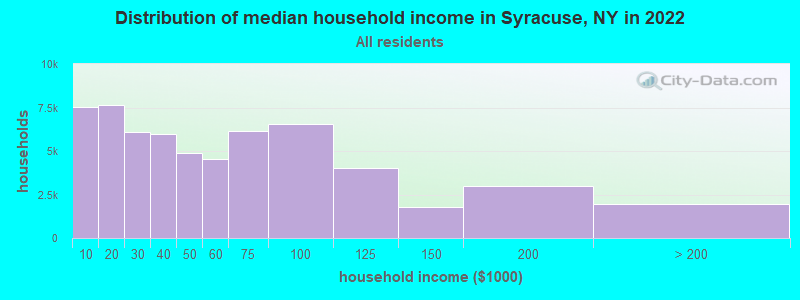
Syracuse, NY household income distribution

- 7,555Less than $10,000
- 7,659$10,000 to $19,999
- 6,081$20,000 to $29,999
- 5,957$30,000 to $39,999
- 4,861$40,000 to $49,999
- 4,555$50,000 to $59,999
- 6,151$60,000 to $74,999
- 6,548$75,000 to $99,999
- 3,997$100,000 to $124,999
- 1,764$125,000 to $149,999
- 2,981$150,000 to $199,999
- 1,969$200,000 or more
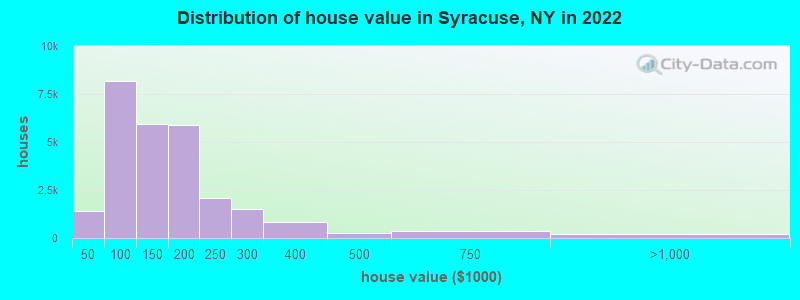
Home value of owner - occupied houses in 2022 in Syracuse, NY
-
- 85Less than $10,000
- 25$15,000 to $19,999
- 72$20,000 to $24,999
- 61$25,000 to $29,999
- 227$30,000 to $34,999
- 171$35,000 to $39,999
- 771$40,000 to $49,999
- 466$50,000 to $59,999
- 1,742$60,000 to $69,999
- 1,434$70,000 to $79,999
- 1,901$80,000 to $89,999
- 1,866$90,000 to $99,999
- 2,831$100,000 to $124,999
- 3,116$125,000 to $149,999
- 4,131$150,000 to $174,999
- 1,772$175,000 to $199,999
- 2,062$200,000 to $249,999
- 1,526$250,000 to $299,999
- 838$300,000 to $399,999
- 273$400,000 to $499,999
- 388$500,000 to $749,999
- 96$750,000 to $999,999
- 70$1,000,000 to $1,499,999
- 43$1,500,000 to $1,999,999
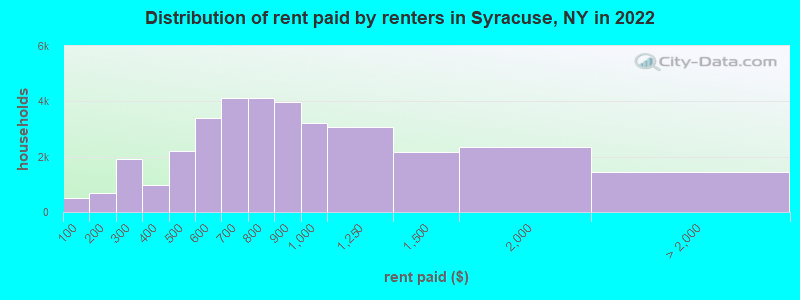
Rent paid by renters in 2022 in Syracuse, NY
-
- 488Less than $100
- 204$100 to $149
- 485$150 to $199
- 556$200 to $249
- 1,352$250 to $299
- 300$300 to $349
- 670$350 to $399
- 1,102$400 to $449
- 1,090$450 to $499
- 1,807$500 to $549
- 1,591$550 to $599
- 2,360$600 to $649
- 1,762$650 to $699
- 2,007$700 to $749
- 2,099$750 to $799
- 3,975$800 to $899
- 3,209$900 to $999
- 3,074$1,000 to $1,249
- 2,171$1,250 to $1,499
- 2,356$1,500 to $1,999
- 724$2,000 to $2,499
- 246$2,500 to $2,999
- 25$3,500 or more
- 458No cash rent
Percentage of workers working in this county: 98.1%
Number of people working at home: 7,379 (12.1% of all workers)
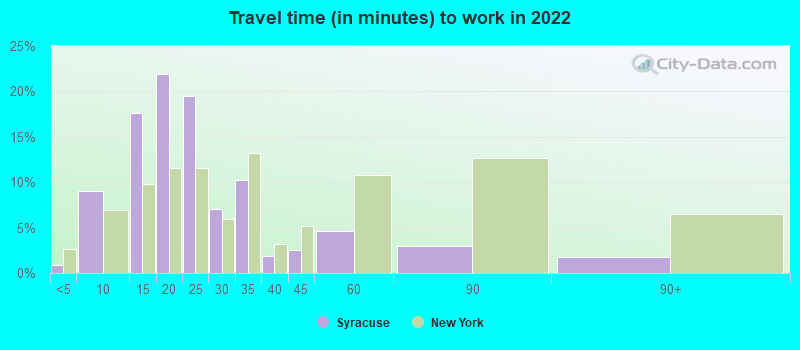
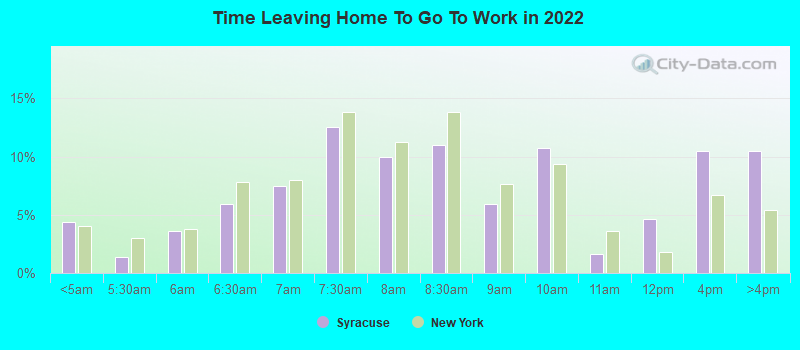
Travel time to work (commute)
- Less than 5 minutes: 1,778
- 5 to 9 minutes: 8,276
- 10 to 14 minutes: 14,340
- 15 to 19 minutes: 13,704
- 20 to 24 minutes: 6,445
- 25 to 29 minutes: 1,490
- 30 to 34 minutes: 3,310
- 35 to 39 minutes: 216
- 40 to 44 minutes: 433
- 45 to 59 minutes: 626
- 60 to 89 minutes: 1,784
- 90 or more minutes: 1,103
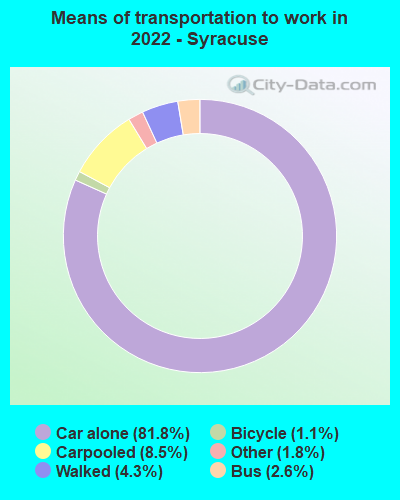
Means of transportation to work:
- Drove a car alone: 69,236 (75.2%)
- Carpooled: 7,216 (7.8%)
- Bus: 2,191 (2.4%)
- Taxi: 1,489 (1.6%)
- Bicycle: 893 (1.0%)
- Walked: 3,633 (3.9%)
- Worked at home: 7,379 (8.0%)
- Unemployment by race in 2022
- Unemployment rate for White non-Hispanic residents
- 4.6%Males
- 4.2%Females
- Unemployment rate for Black residents
- 8.6%Males
- 13.6%Females
- Unemployment rate for American Indian and Alaska Native residents
- 8.3%Females
- Unemployment rate for Asian residents
- 5.8%Males
- 11.9%Females
- Unemployment rate for other race residents
- 9.4%Males
- 3.1%Females
- Unemployment rate for two or more race residents
- 10.0%Males
- 11.6%Females
- Unemployment rate for Hispanic or Latino residents
- 6.4%Males
- 12.0%Females
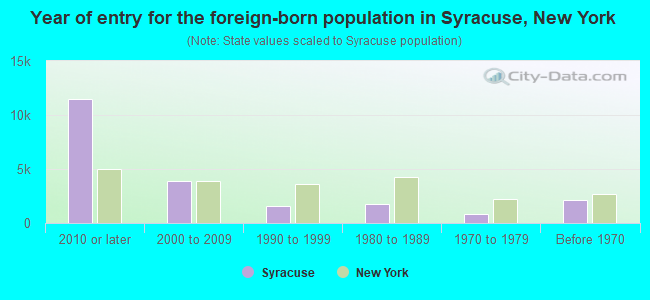
- Year of entry for the foreign-born population in Syracuse, New York
- 11,4862010 or later
- 3,9042000 to 2009
- 1,6081990 to 1999
- 1,7351980 to 1989
- 8081970 to 1979
- 2,147Before 1970
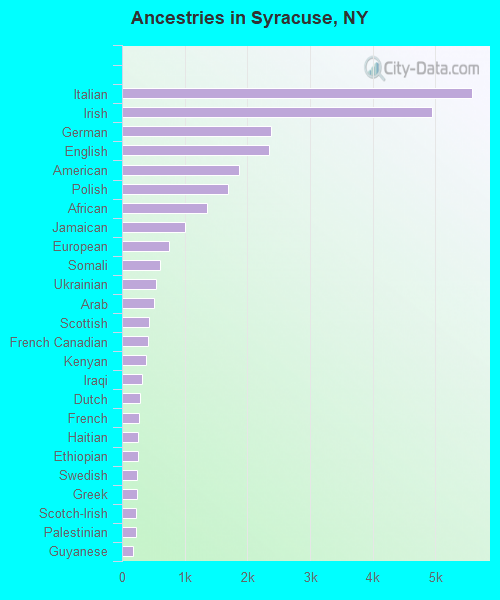
First ancestries reported:
- Italian: 5,575 (8.0%)
- Irish: 4,951 (7.1%)
- German: 2,379 (3.4%)
- English: 2,341 (3.4%)
- American: 1,870 (2.7%)
- Polish: 1,697 (2.4%)
- African: 1,361 (2.0%)
- Jamaican: 1,004 (1.4%)
- European: 742 (1.1%)
- Somali: 607 (0.9%)
- Ukrainian: 543 (0.8%)
- Arab: 516 (0.7%)
- Scottish: 438 (0.6%)
- French Canadian: 412 (0.6%)
- Kenyan: 385 (0.6%)
- Iraqi: 312 (0.4%)
- Dutch: 288 (0.4%)
- French: 268 (0.4%)
- Haitian: 261 (0.4%)
- Ethiopian: 253 (0.4%)
- Swedish: 243 (0.4%)
- Greek: 235 (0.3%)
- Scotch-Irish: 221 (0.3%)
- Palestinian: 217 (0.3%)
- Guyanese: 183 (0.3%)
- Ghanaian: 179 (0.3%)
- Afghan: 173 (0.2%)
- Russian: 170 (0.2%)
- Syrian: 159 (0.2%)
- Northern European: 151 (0.2%)
- Norwegian: 149 (0.2%)
- Sudanese: 146 (0.2%)
- Eastern European: 132 (0.2%)
- British: 126 (0.2%)
- Egyptian: 120 (0.2%)
- Iranian: 113 (0.2%)
- Yugoslavian: 105 (0.2%)
- Nigerian: 105 (0.2%)
- Turkish: 101 (0.1%)
- Hungarian: 100 (0.1%)
- Trinidadian and Tobagonian: 93 (0.1%)
- Brazilian: 84 (0.1%)
- British West Indian: 82 (0.1%)
- Canadian: 80 (0.1%)
- West Indian: 77 (0.1%)
- Liberian: 61 (0.09%)
- Austrian: 60 (0.09%)
- South African: 59 (0.09%)
- Scandinavian: 57 (0.08%)
- Zimbabwean: 57 (0.08%)
- Slavic: 56 (0.08%)
- Welsh: 49 (0.07%)
- Barbadian: 47 (0.07%)
- Danish: 46 (0.07%)
- Lithuanian: 44 (0.06%)
- Finnish: 41 (0.06%)
- Swiss: 38 (0.05%)
- Portuguese: 36 (0.05%)
- Slovak: 35 (0.05%)
- Macedonian: 31 (0.04%)
- Armenian: 22 (0.03%)
- Czech: 21 (0.03%)
- Pennsylvania German: 19 (0.03%)
- Lebanese: 16 (0.02%)
- Croatian: 15 (0.02%)
- Slovene: 12 (0.02%)
- Albanian: 12 (0.02%)
- Bulgarian: 11 (0.02%)
- Bahamian: 11 (0.02%)
- Israeli: 10 (0.01%)
- Serbian: 8 (0.01%)
- Czechoslovakian: 6 (0.01%)
- Basque: 6 (0.01%)
Most common places of birth for foreign-born residents (%):
| Syracuse: | 10.8% (2,026) |
| New York: | 9.1% (410,910) |
| Syracuse: | 5.9% (1,115) |
| New York: | 0.1% (3,340) |
| Syracuse: | 4.9% (916) |
| New York: | 0.6% (25,517) |
| Syracuse: | 4.2% (794) |
| New York: | 5.0% (227,557) |
| Syracuse: | 3.8% (722) |
| New York: | 0.4% (16,179) |
| Syracuse: | 3.6% (672) |
| New York: | 0.1% (4,282) |
| Syracuse: | 3.4% (641) |
| New York: | 3.5% (158,432) |
| Syracuse: | 3.1% (587) |
| New York: | 0.5% (23,242) |
| Syracuse: | 2.7% (500) |
| New York: | 0.1% (3,762) |
| Syracuse: | 2.5% (475) |
| New York: | 0.1% (6,152) |
| Syracuse: | 2.5% (470) |
| New York: | 0.3% (11,801) |
| Syracuse: | 2.2% (410) |
| New York: | 0.1% (2,563) |
| Syracuse: | 2.2% (406) |
| New York: | 1.8% (82,786) |
| Syracuse: | 2.0% (379) |
| New York: | 0.2% (7,798) |
| Syracuse: | 2.0% (371) |
| New York: | 0.0% (1,517) |
| Syracuse: | 1.9% (361) |
| New York: | 11.1% (501,040) |
| Syracuse: | 1.9% (351) |
| New York: | 2.5% (111,920) |
| Syracuse: | 1.5% (289) |
| New York: | 0.9% (39,058) |
Place of birth for U.S.-born residents:
- This state: 94,822
- Other state: 29,287
- Northeast: 10,269
- Midwest: 3,745
- South: 10,515
- West: 4,758
76.2% of Syracuse residents lived in the same house 1 years ago.
Out of people who lived in different houses, 36.6% lived in this county.
Out of people who lived in different counties, 36.7% lived in New York.
| Syracuse: | 76.2% |
| State average: | 89.6% |
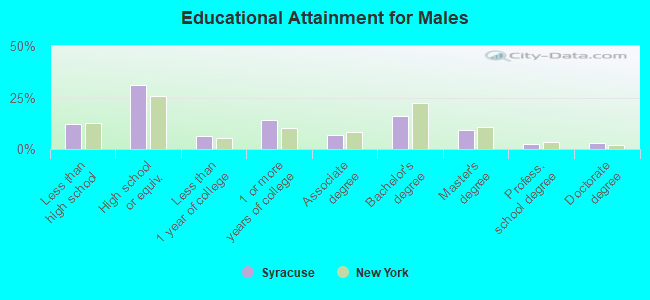
Education attainment for males 25 years and older:
- No schooling: 1,124
- Nursery to 4th grade: 149
- 5th and 6th grade: 0
- 7th and 8th grade: 333
- 9th grade: 668
- 10th grade: 1,018
- 11th grade: 621
- 12th grade, no diploma: 1,087
- High school graduate (or equivalency): 12,989
- Less than 1 year of college: 2,690
- Some college more than 1 year, no degree: 5,856
- Associate degree: 2,851
- Bachelor's degree: 6,622
- Master's degree: 3,812
- Professional school degree: 921
- Doctorate degree: 1,209
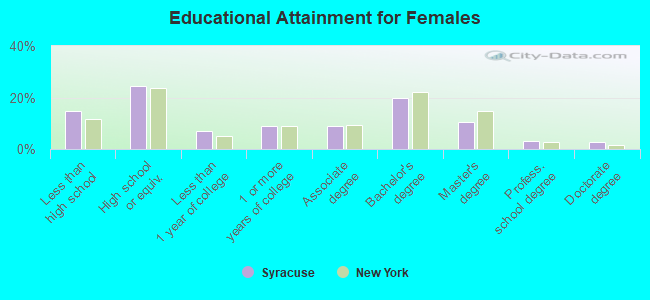
Education attainment for females 25 years and older:
- No schooling: 1,101
- Nursery to 4th grade: 244
- 5th and 6th grade: 284
- 7th and 8th grade: 591
- 9th grade: 310
- 10th grade: 1,672
- 11th grade: 1,306
- 12th grade, no diploma: 1,260
- High school graduate (or equivalency): 11,191
- Less than 1 year of college: 3,270
- Some college more than 1 year, no degree: 4,094
- Associate degree: 4,062
- Bachelor's degree: 8,996
- Master's degree: 4,756
- Professional school degree: 1,355
- Doctorate degree: 1,201


Housing units in structures:
- One, detached: 28,283
- One, attached: 2,528
- Two: 10,848
- 3 or 4: 5,862
- 5 to 9: 3,364
- 10 to 19: 3,558
- 20 to 49: 4,395
- 50 or more: 7,238
- Mobile homes: 274
Housing units lacking complete kitchen facilities in 2022: 4.1%
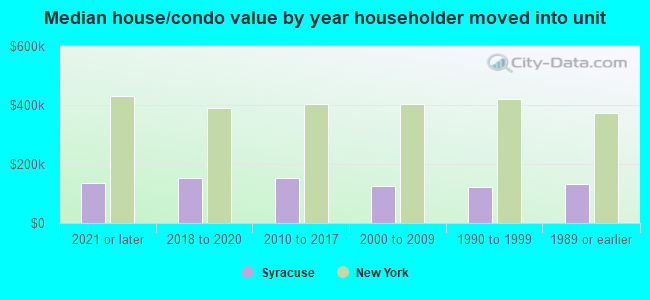
House/condo owner moved in on average 14 years ago
Renter moved in on average 3 years ago
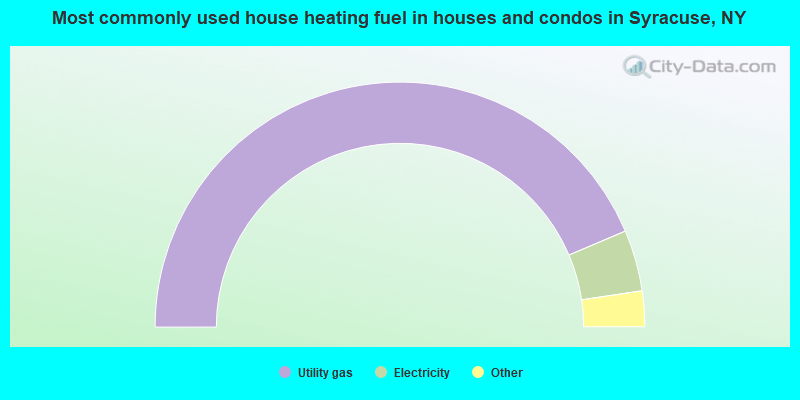
- 87.2%Utility gas
- 8.1%Electricity
- 2.1%Fuel oil, kerosene, etc.
- 1.1%Bottled, tank, or LP gas
- 0.4%No fuel used
- 0.4%Other fuel
- 0.4%Solar energy
- 0.3%Wood
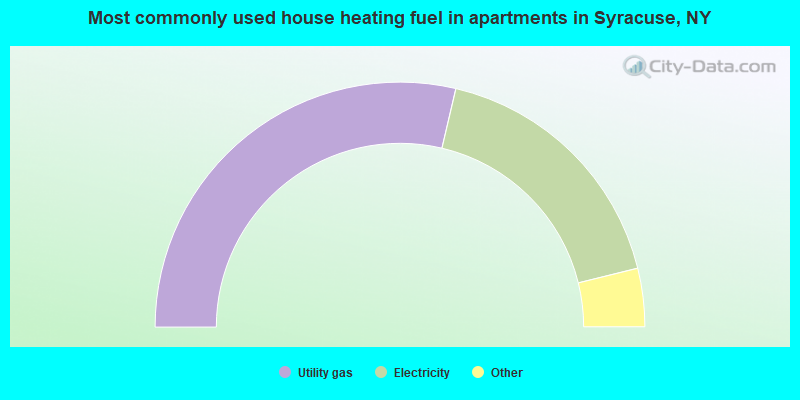
- 57.4%Utility gas
- 35.0%Electricity
- 2.5%Bottled, tank, or LP gas
- 1.9%No fuel used
- 1.7%Fuel oil, kerosene, etc.
- 1.4%Other fuel
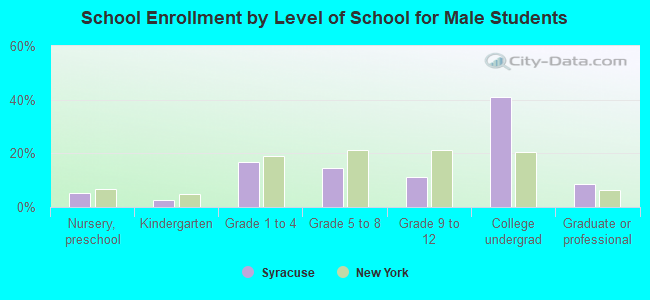
Private vs. public school enrollment:
| Here: | 6.6% |
| New York: | 15.6% |
| Here: | 0.7% |
| New York: | 15.0% |
| Here: | 50.2% |
| New York: | 39.2% |