Stevensville, MD (Maryland) Houses and Residents
| Stevensville: | $466,839 |
| Maryland: | $398,100 |
Mean price in 2022:
Detached houses: $603,183
Here: $603,183 State: $526,819 Townhouses or other attached units: $403,776
Here: $403,776 State: $328,305 In 3-to-4-unit structures: $223,382
Here: $223,382 State: $295,378 In 5-or-more-unit structures: $254,049
Here: $254,049 State: $350,378
Total population: 6,803 (Urban population: 5,734 (all inside urban clusters), Rural population: 148 (all nonfarm))
Houses: 3,363 (3,252 occupied: 2,341 owner occupied, 956 renter occupied)
| % of renters here: | 29% |
| State: | 32% |
Housing density: 548 houses/condos per square mile
Median price asked for vacant for-sale houses and condos in 2022: $2,563,617.
Median contract rent in 2022: $1,508
Median rent asked for vacant for-rent units in 2022: $770
Median gross rent in Stevensville, MD in 2022: $1,731
Housing units in Stevensville with a mortgage: 1,812 (188 second mortgage, 16 home equity loan, 142 both second mortgage and home equity loan)
Houses without a mortgage: 0
Median household income for houses/condos with a mortgage: $154,325
Median monthly housing costs: $2,056
Compare current foreclosures near Stevensville, MD:
| Photo | Address | Area | Beds / Baths | Price | Details |
|---|---|---|---|---|---|

|
#1
Wallman Way
Stevensville, MD 21666
|
1,752 sq. feet
|
3 baths - beds |
show details | |

|
#2
Conor Dr
Stevensville, MD 21666
|
2,760 sq. feet
|
4 baths - beds |
show details | |

|
#3
Larch Pl
Stevensville, MD 21666
|
2,092 sq. feet
|
2 baths - beds |
show details | |

|
#4
Reynolds Dr
Stevensville, MD 21666
|
1,500 sq. feet
|
2 baths - beds |
show details | |

|
#5
Old Love Point Rd
Stevensville, MD 21666
|
1,738 sq. feet
|
2 baths - beds |
show details | |

|
#6
Larch Pl
Stevensville, MD 21666
|
1,290 sq. feet
|
2 baths - beds |
show details | |

|
#7
Old Love Point Rd
Stevensville, MD 21666
|
1,288 sq. feet
|
2 baths - beds |
show details | |

|
#8
Kentmorr Rd
Stevensville, MD 21666
|
2,076 sq. feet
|
2 baths - beds |
show details | |

|
#9
Bayside Dr
Stevensville, MD 21666
|
2,024 sq. feet
|
4 baths - beds |
show details | |

|
#10
Long Point Rd
Stevensville, MD 21666
|
1,932 sq. feet
|
1 baths - beds |
show details |
| Photo | Address | Area | Beds / Baths | Price | Details |
|---|---|---|---|---|---|

|
#11
Victoria Dr
Stevensville, MD 21666
|
1,524 sq. feet
|
2 baths - beds |
show details | |

|
#12
Buckingham Dr
Stevensville, MD 21666
|
1,119 sq. feet
|
1 baths - beds |
show details | |

|
#13
Birch Rd
Stevensville, MD 21666
|
1,596 sq. feet
|
2 baths - beds |
show details | |

|
#14
Marion Quimby Dr
Stevensville, MD 21666
|
1,344 sq. feet
|
2 baths - beds |
show details | |

|
#15
Victoria Dr
Stevensville, MD 21666
|
1,424 sq. feet
|
1 baths - beds |
show details | |

|
#16
Duke St
Stevensville, MD 21666
|
960 sq. feet
|
1 baths - beds |
show details | |

|
#17
Chesapeake Dr
Stevensville, MD 21666
|
2,040 sq. feet
|
2 baths - beds |
show details | |

|
#18
Zaidee Ln
Stevensville, MD 21666
|
2,208 sq. feet
|
1 baths - beds |
show details | |

|
#19
Anthony Ln
Stevensville, MD 21666
|
- sq. feet
|
- baths - beds |
show details | |

|
#20
Cloverfields Dr
Stevensville, MD 21666
|
- sq. feet
|
- baths - beds |
show details |
| Photo | Address | Area | Beds / Baths | Price | Details |
|---|---|---|---|---|---|

|
#21
Terrapin Grv Apt 106
Stevensville, MD 21666
|
- sq. feet
|
- baths - beds |
show details | |

|
#22
Conor Dr
Stevensville, MD 21666
|
- sq. feet
|
- baths - beds |
show details | |

|
#23
Silverwood Cir Apt 2
Annapolis, MD 21403
|
1,312 sq. feet
|
2 baths 2 beds |
$249,600
|
show details |

|
#24
Bay Ridge Rd
Edgewater, MD 21037
|
2,951 sq. feet
|
3 baths 3 beds |
$615,000
|
show details |

|
#25
Dennis Rd
Shady Side, MD 20764
|
1,376 sq. feet
|
2 baths 3 beds |
show details | |

|
#26
Arundel Rd
Pasadena, MD 21122
|
1,568 sq. feet
|
1 baths 3 beds |
show details | |

|
#27
Sampson Ln
Grasonville, MD 21638
|
2,445 sq. feet
|
2 baths 4 beds |
show details | |

|
#28
Eddy Rd
Crownsville, MD 21032
|
1,100 sq. feet
|
2 baths 2 beds |
show details | |

|
#29
W Earleigh Heights Rd
Severna Park, MD 21146
|
912 sq. feet
|
1 baths - beds |
show details | |

|
#30
Nick Rd
Shady Side, MD 20764
|
864 sq. feet
|
1 baths - beds |
show details |
| Photo | Address | Area | Beds / Baths | Price | Details |
|---|---|---|---|---|---|

|
#31
D St
Pasadena, MD 21122
|
968 sq. feet
|
2 baths - beds |
show details | |

|
#32
Stoney Creek Dr
Pasadena, MD 21122
|
1,108 sq. feet
|
2 baths - beds |
show details | |

|
#33
Brent Rd
Arnold, MD 21012
|
816 sq. feet
|
2 baths - beds |
show details | |

|
#34
12th St
Pasadena, MD 21122
|
1,384 sq. feet
|
1 baths - beds |
show details | |

|
#35
Lockwood Rd
Pasadena, MD 21122
|
1,150 sq. feet
|
2 baths - beds |
show details | |

|
#36
Sycamore Rd
Severna Park, MD 21146
|
1,708 sq. feet
|
2 baths - beds |
show details | |

|
#37
Blackwalnut Ct
Annapolis, MD 21403
|
1,696 sq. feet
|
3 baths - beds |
show details | |

|
#38
Gatewood Ct
Pasadena, MD 21122
|
988 sq. feet
|
2 baths - beds |
show details | |

|
#39
Walnut Ave
Annapolis, MD 21403
|
1,388 sq. feet
|
1 baths - beds |
show details | |

|
#40
Perch Dr
Riva, MD 21140
|
1,880 sq. feet
|
2 baths - beds |
show details |
| Photo | Address | Area | Beds / Baths | Price | Details |
|---|---|---|---|---|---|

|
#41
Parole St
Annapolis, MD 21401
|
480 sq. feet
|
1 baths - beds |
show details | |

|
#42
Wall Dr
Pasadena, MD 21122
|
1,408 sq. feet
|
1 baths - beds |
show details | |

|
#43
Tripp Creek Ct
Annapolis, MD 21401
|
1,382 sq. feet
|
3 baths - beds |
show details | |

|
#44
Paddington Pl
Annapolis, MD 21403
|
1,560 sq. feet
|
2 baths - beds |
show details | |

|
#45
Quaker Ridge Ct
Arnold, MD 21012
|
1,160 sq. feet
|
2 baths - beds |
show details | |

|
#46
Steamboat Rd
Shady Side, MD 20764
|
1,240 sq. feet
|
1 baths - beds |
show details | |

|
#47
Forest Dr
Annapolis, MD 21401
|
884 sq. feet
|
2 baths - beds |
show details | |

|
#48
Brightwater Dr
Annapolis, MD 21401
|
1,452 sq. feet
|
3 baths - beds |
show details | |

|
#49
Deep Creek Ave
Arnold, MD 21012
|
1,648 sq. feet
|
1 baths - beds |
show details | |

|
Check over 1 million property listings on Foreclosure.com!
|
browse all offers | |||

Latest news about housing in Stevensville, MD collected exclusively by city-data.com from local newspapers, TV, and radio stations


Median year apartment built: 1993
Household type by relationship:
Households: 8,489- Male householders: 1,652 (352 living alone), Female householders: 1,565 (401 living alone)
1,864 spouses (1,864 opposite-sex spouses), 174 unmarried partners, (174 opposite-sex unmarried partners), 2,792 children (2,573 natural, 18 adopted, 201 stepchildren), 59 grandchildren, 11 brothers or sisters, 192 parents, 0 foster children, 40 other relatives, 133 non-relatives
- In group quarters: 4
Size of family households: 921 2-persons, 606 3-persons, 673 4-persons, 138 5-persons, 32 6-persons, 13 7-or-more-persons.
Size of nonfamily households: 787 1-person, 93 2-persons, 20 4-persons.
1,469 married couples with children.
468 single-parent households (139 men, 329 women).
93.8% of residents of Stevensville speak English at home.
3.5% of residents speak Spanish at home (73% speak English very well, 16% speak English well, 11% speak English not well).
0.5% of residents speak other Indo-European language at home (32% speak English very well, 50% speak English well, 18% speak English not well).
1.4% of residents speak Asian or Pacific Island language at home (60% speak English very well, 40% speak English not well).
Foreign born population: 481 (5.7%)
(60.7% of them are naturalized citizens)
| Here: | 7.4 |
| State: | 7.3 |
| Here: | 4.7 |
| State: | 4.2 |

- Bedrooms in owner-occupied houses and condos in Stevensville, Maryland
- 0no bedroom
- 01 bedroom
- 1592 bedrooms
- 1,0743 bedrooms
- 8784 bedrooms
- 2305+ bedrooms

- Bedrooms in renter-occupied apartments in Stevensville, Maryland
- 17no bedroom
- 2941 bedroom
- 2142 bedrooms
- 4053 bedrooms
- 264 bedrooms
- 05+ bedrooms

- Cars and other vehicles available in Stevensville in owner-occupied houses/condos
- 19no vehicle
- 3761 vehicle
- 1,0152 vehicles
- 6403 vehicles
- 2614 vehicles
- 305+ vehicles

- Cars and other vehicles available in Stevensville in renter-occupied apartments
- 154no vehicle
- 5151 vehicle
- 1632 vehicles
- 1193 vehicles
- 64 vehicles
- 05+ vehicles

- Rooms in owner-occupied houses in Stevensville, Maryland
- 01 room
- 02 rooms
- 03 rooms
- 894 rooms
- 2945 rooms
- 4166 rooms
- 3937 rooms
- 5728 rooms
- 5779+ rooms

- Rooms in renter-occupied apartments in Stevensville, Maryland
- 171 room
- 02 rooms
- 1673 rooms
- 2034 rooms
- 3225 rooms
- 1346 rooms
- 767 rooms
- 08 rooms
- 379+ rooms


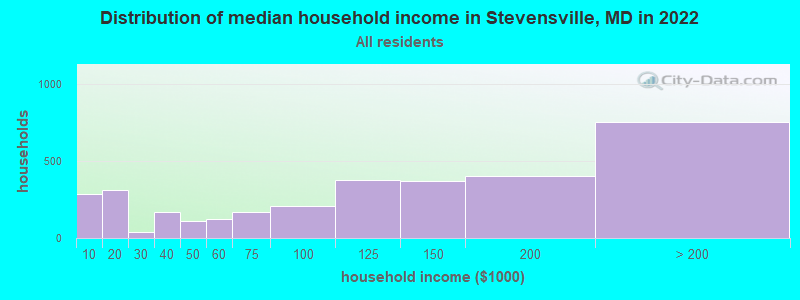
Stevensville, MD household income distribution

- 283Less than $10,000
- 308$10,000 to $19,999
- 42$20,000 to $29,999
- 167$30,000 to $39,999
- 108$40,000 to $49,999
- 124$50,000 to $59,999
- 166$60,000 to $74,999
- 207$75,000 to $99,999
- 374$100,000 to $124,999
- 370$125,000 to $149,999
- 403$150,000 to $199,999
- 752$200,000 or more
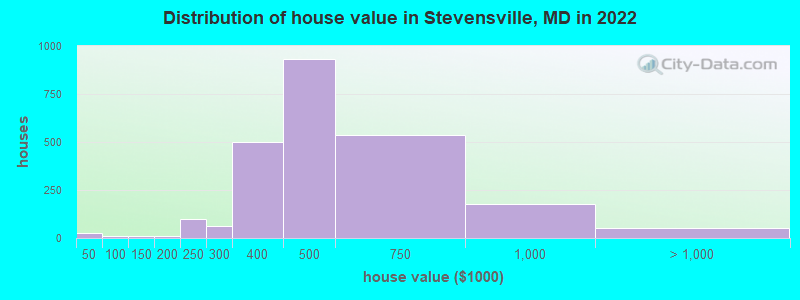
Home value of owner - occupied houses in 2022 in Stevensville, MD
-
- 18Less than $10,000
- 9$20,000 to $24,999
- 7$50,000 to $59,999
- 12$125,000 to $149,999
- 8$175,000 to $199,999
- 100$200,000 to $249,999
- 62$250,000 to $299,999
- 500$300,000 to $399,999
- 931$400,000 to $499,999
- 534$500,000 to $749,999
- 175$750,000 to $999,999
- 22$1,500,000 to $1,999,999
- 29$2,000,000 or more
Rent paid by renters in 2022 in Stevensville, MD
-
- 37$100 to $149
- 123$450 to $499
- 39$500 to $549
- 20$600 to $649
- 13$700 to $749
- 96$1,000 to $1,249
- 60$1,250 to $1,499
- 267$1,500 to $1,999
- 151$2,000 to $2,499
- 9$2,500 to $2,999
- 14$3,500 or more
- 77No cash rent


Percentage of workers working in this county: 52.5%
Number of people working at home: 618 (13.9% of all workers)
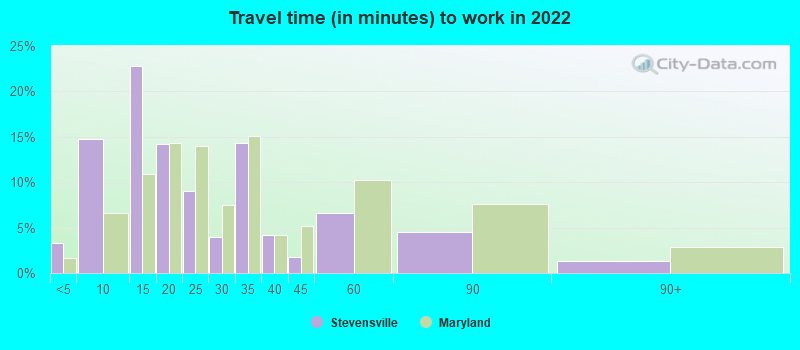
Travel time to work (commute)
- Less than 5 minutes: 131
- 5 to 9 minutes: 662
- 10 to 14 minutes: 434
- 15 to 19 minutes: 276
- 20 to 24 minutes: 360
- 25 to 29 minutes: 425
- 30 to 34 minutes: 255
- 35 to 39 minutes: 115
- 40 to 44 minutes: 159
- 45 to 59 minutes: 529
- 60 to 89 minutes: 343
- 90 or more minutes: 70
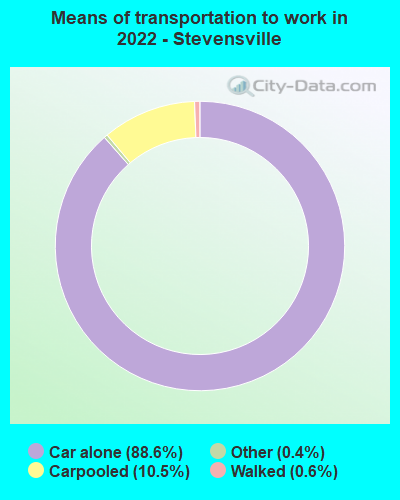
Means of transportation to work:
- Drove a car alone: 2,946 (73.8%)
- Carpooled: 369 (9.2%)
- Taxi: 14 (0.4%)
- Walked: 17 (0.4%)
- Worked at home: 618 (15.5%)

- Unemployment by race in 2022
- Unemployment rate for White non-Hispanic residents
- 1.9%Males
- 3.5%Females
- Unemployment rate for Black residents
- 17.3%Females
- Unemployment rate for two or more race residents
- 42.4%Males

- Year of entry for the foreign-born population in Stevensville, Maryland
- 1382010 or later
- 512000 to 2009
- 1201990 to 1999
- 261980 to 1989
- 311970 to 1979
- 17Before 1970

First ancestries reported:
- English: 669 (17.1%)
- German: 628 (16.1%)
- Irish: 337 (8.6%)
- American: 295 (7.5%)
- Italian: 190 (4.9%)
- Scottish: 138 (3.5%)
- Polish: 119 (3.0%)
- European: 48 (1.2%)
- Pennsylvania German: 40 (1.0%)
- Welsh: 30 (0.8%)
- Greek: 29 (0.7%)
- Armenian: 24 (0.6%)
- Swedish: 20 (0.5%)
- Scotch-Irish: 16 (0.4%)
- Ukrainian: 16 (0.4%)
- Jamaican: 15 (0.4%)
- Eastern European: 11 (0.3%)
- Danish: 9 (0.2%)
- British: 7 (0.2%)
- Dutch: 5 (0.1%)
Most common places of birth for foreign-born residents (%):
| Stevensville: | 25.5% (123) |
| Maryland: | 3.8% (36,698) |
| Stevensville: | 17.2% (83) |
| Maryland: | 0.3% (3,203) |
| Stevensville: | 10.2% (49) |
| Maryland: | 4.6% (44,742) |
| Stevensville: | 9.8% (47) |
| Maryland: | 0.5% (4,901) |
| Stevensville: | 8.9% (43) |
| Maryland: | 0.3% (3,238) |
| Stevensville: | 8.7% (42) |
| Maryland: | 0.1% (638) |
| Stevensville: | 7.7% (37) |
| Maryland: | 1.8% (17,161) |
| Stevensville: | 3.7% (18) |
| Maryland: | 1.2% (11,265) |
| Stevensville: | 3.7% (18) |
| Maryland: | 0.6% (5,899) |
| Stevensville: | 3.5% (17) |
| Maryland: | 3.4% (32,635) |
| Stevensville: | 3.3% (16) |
| Maryland: | 3.5% (34,065) |
| Stevensville: | 2.9% (14) |
| Maryland: | 0.4% (3,418) |
Place of birth for U.S.-born residents:
- This state: 5,334
- Other state: 2,523
- Northeast: 1,040
- Midwest: 498
- South: 805
- West: 195
91.1% of Stevensville residents lived in the same house 1 years ago.
Out of people who lived in different houses, 24.2% lived in this county.
Out of people who lived in different counties, 33.1% lived in Maryland.
| Stevensville: | 91.1% |
| State average: | 88.5% |
Education attainment for males 25 years and older:
- No schooling: 12
- Nursery to 4th grade: 20
- 5th and 6th grade: 0
- 7th and 8th grade: 0
- 9th grade: 43
- 10th grade: 0
- 11th grade: 16
- 12th grade, no diploma: 56
- High school graduate (or equivalency): 773
- Less than 1 year of college: 363
- Some college more than 1 year, no degree: 406
- Associate degree: 183
- Bachelor's degree: 750
- Master's degree: 216
- Professional school degree: 56
- Doctorate degree: 44

Education attainment for females 25 years and older:
- No schooling: 23
- Nursery to 4th grade: 0
- 5th and 6th grade: 0
- 7th and 8th grade: 7
- 9th grade: 10
- 10th grade: 190
- 11th grade: 5
- 12th grade, no diploma: 15
- High school graduate (or equivalency): 709
- Less than 1 year of college: 152
- Some college more than 1 year, no degree: 225
- Associate degree: 307
- Bachelor's degree: 878
- Master's degree: 193
- Professional school degree: 103
- Doctorate degree: 58


Housing units in structures:
- One, detached: 2,688
- One, attached: 214
- 3 or 4: 93
- 5 to 9: 285
- 50 or more: 78
- Mobile homes: 4
Housing units lacking complete kitchen facilities in 2022: 2.9%
House/condo owner moved in on average 8 years ago
Renter moved in on average 1 years ago

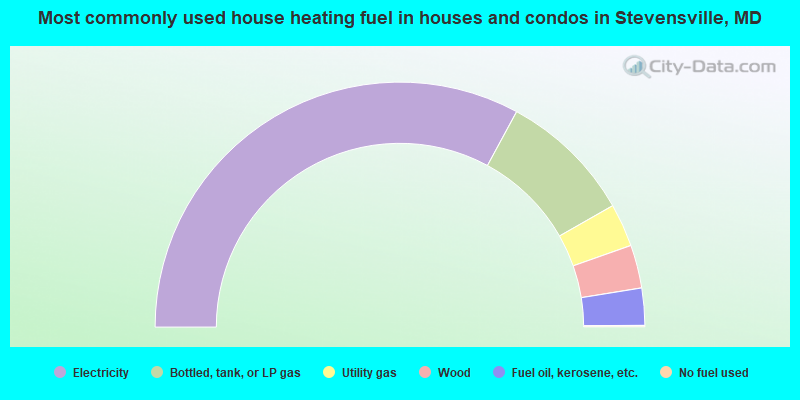
- 65.8%Electricity
- 17.7%Bottled, tank, or LP gas
- 5.7%Utility gas
- 5.7%Wood
- 4.9%Fuel oil, kerosene, etc.
- 0.2%No fuel used
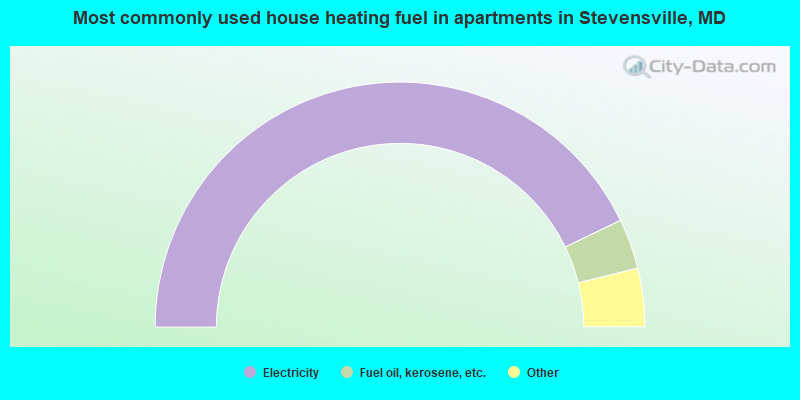
- 85.6%Electricity
- 6.6%Fuel oil, kerosene, etc.
- 3.2%Wood
- 2.7%Utility gas
- 1.8%Bottled, tank, or LP gas
Private vs. public school enrollment:
| Here: | 3.7% |
| Maryland: | 15.2% |
| Here: | 9.4% |
| Maryland: | 14.4% |
| Here: | 0.0% |
| Maryland: | 20.2% |


