Staten Island, NY (New York) Houses and Residents
| Staten Island: | $632,900 |
| New York: | $400,400 |
Total population: 481,026 (Urban population: 443,728, Rural population: 0)
Houses: 163,993 (156,341 occupied: 99,732 owner occupied, 56,609 renter occupied)
| % of renters here: | 36% |
| State: | 46% |
Housing density: 2,804 houses/condos per square mile
Median price asked for vacant for-sale houses and condos in 2022 in this county: $255,508.
Median contract rent in 2022: $1,516 (lower quartile is $1,007, upper quartile is $1,904)
Median rent asked for vacant for-rent units in 2022: $1,532
Median gross rent in Staten Island, NY in 2022: $1,669
Housing units in Staten Island with a mortgage: 57,986 (4,499 second mortgage, 5,623 home equity loan, 160 both second mortgage and home equity loan)
Houses without a mortgage: 19,289
Compare current foreclosures in Staten Island, NY:
| Photo | Address | Area | Beds / Baths | Price | Details |
|---|---|---|---|---|---|

|
#1
Russell St # G
Staten Island, NY 10308
|
642 sq. feet
|
1 baths 1 beds |
$185,000
|
show details |

|
#2
Narrows Rd N
Staten Island, NY 10305
|
- sq. feet
|
1 baths 3 beds |
$424,500
|
show details |

|
#3
Richmond Rd
Staten Island, NY 10304
|
- sq. feet
|
1 baths 3 beds |
$571,000
|
show details |

|
#4
Willow Rd W
Staten Island, NY 10314
|
- sq. feet
|
1 baths 3 beds |
$491,400
|
show details |

|
#5
Clove Rd Apt Go
Staten Island, NY 10301
|
800 sq. feet
|
2 baths 2 beds |
show details | |

|
#6
Newark Ave
Staten Island, NY 10302
|
1,120 sq. feet
|
1 baths 3 beds |
show details | |

|
#7
Rigimar Ct
Staten Island, NY 10309
|
2,600 sq. feet
|
3 baths 5 beds |
show details | |

|
#8
Father Capodanno Blvd
Staten Island, NY 10305
|
1,344 sq. feet
|
2 baths 4 beds |
show details | |

|
#9
Richmond Rd
Staten Island, NY 10306
|
3,960 sq. feet
|
2 baths 4 beds |
show details | |

|
#10
Mansion Ave
Staten Island, NY 10308
|
960 sq. feet
|
1 baths 2 beds |
show details |
| Photo | Address | Area | Beds / Baths | Price | Details |
|---|---|---|---|---|---|

|
#11
Saint Pauls Ave
Staten Island, NY 10301
|
2,350 sq. feet
|
2 baths 6 beds |
show details | |

|
#12
Hammock Ln
Staten Island, NY 10312
|
2,000 sq. feet
|
1 baths 3 beds |
show details | |

|
#13
Lincoln Ave Apt 6j
Staten Island, NY 10306
|
1,137 sq. feet
|
2 baths 3 beds |
show details | |

|
#14
Prince St
Staten Island, NY 10304
|
1,176 sq. feet
|
1 baths 3 beds |
show details | |

|
#15
Brunswick St
Staten Island, NY 10314
|
2,600 sq. feet
|
2 baths 4 beds |
show details | |

|
#16
Gabriele Ct
Staten Island, NY 10312
|
2,100 sq. feet
|
3 baths 3 beds |
show details | |

|
#17
Continental Pl
Staten Island, NY 10303
|
1,000 sq. feet
|
1 baths 2 beds |
show details | |

|
#18
Coursen Pl
Staten Island, NY 10304
|
1,402 sq. feet
|
1 baths 3 beds |
show details | |

|
#19
Tompkins Ct
Staten Island, NY 10310
|
1,890 sq. feet
|
1 baths 3 beds |
show details | |

|
#20
Cebra Ave
Staten Island, NY 10304
|
- sq. feet
|
2 baths 2 beds |
show details |
| Photo | Address | Area | Beds / Baths | Price | Details |
|---|---|---|---|---|---|

|
#21
Courtney Loop
Staten Island, NY 10305
|
- sq. feet
|
2 baths 5 beds |
show details | |

|
#22
Dinsmore St Apt H
Staten Island, NY 10314
|
2,219 sq. feet
|
- baths - beds |
show details | |

|
#23
Amelia Ct
Staten Island, NY 10310
|
1,930 sq. feet
|
- baths - beds |
show details | |

|
#24
Tompkins Pl
Staten Island, NY 10304
|
1,200 sq. feet
|
- baths - beds |
show details | |

|
#25
Ogden St
Staten Island, NY 10312
|
1,056 sq. feet
|
- baths - beds |
show details | |

|
#26
Walnut Ave
Staten Island, NY 10308
|
1,298 sq. feet
|
- baths - beds |
show details | |

|
#27
Shale St
Staten Island, NY 10314
|
1,528 sq. feet
|
- baths - beds |
show details | |

|
#28
Eadie Pl
Staten Island, NY 10301
|
1,971 sq. feet
|
- baths - beds |
show details | |

|
#29
Katan Ave
Staten Island, NY 10308
|
2,152 sq. feet
|
- baths - beds |
show details | |

|
#30
Deserre Ave
Staten Island, NY 10312
|
2,660 sq. feet
|
- baths - beds |
show details |
| Photo | Address | Area | Beds / Baths | Price | Details |
|---|---|---|---|---|---|

|
#31
Mcveigh Ave
Staten Island, NY 10314
|
1,360 sq. feet
|
- baths - beds |
show details | |

|
#32
University Pl
Staten Island, NY 10301
|
1,200 sq. feet
|
- baths - beds |
show details | |

|
#33
Opal Ln
Staten Island, NY 10309
|
2,400 sq. feet
|
- baths - beds |
show details | |

|
#34
10th St
Staten Island, NY 10306
|
1,716 sq. feet
|
- baths - beds |
show details | |

|
#35
Armstrong Ave
Staten Island, NY 10308
|
2,912 sq. feet
|
- baths - beds |
show details | |

|
#36
Woolley Ave
Staten Island, NY 10314
|
1,290 sq. feet
|
- baths - beds |
show details | |

|
#37
Greencroft Ave
Staten Island, NY 10308
|
1,176 sq. feet
|
- baths - beds |
show details | |

|
#38
Seguine Pl
Staten Island, NY 10312
|
1,068 sq. feet
|
- baths - beds |
show details | |

|
#39
Rolling Hill Grn
Staten Island, NY 10312
|
1,441 sq. feet
|
- baths - beds |
show details | |

|
#40
Marne Ave
Staten Island, NY 10312
|
2,524 sq. feet
|
- baths - beds |
show details |
| Photo | Address | Area | Beds / Baths | Price | Details |
|---|---|---|---|---|---|

|
#41
Ocean Ave
Staten Island, NY 10305
|
4,668 sq. feet
|
- baths - beds |
show details | |

|
#42
Sanford Pl
Staten Island, NY 10314
|
2,701 sq. feet
|
- baths - beds |
show details | |

|
#43
Bay St
Staten Island, NY 10305
|
1,200 sq. feet
|
- baths - beds |
show details | |

|
#44
Mariners Ln
Staten Island, NY 10303
|
1,260 sq. feet
|
- baths - beds |
show details | |

|
#45
Shore Acres Rd
Staten Island, NY 10305
|
1,838 sq. feet
|
- baths - beds |
show details | |

|
#46
Wright Ave
Staten Island, NY 10303
|
2,028 sq. feet
|
- baths - beds |
show details | |

|
#47
N Railroad Ave
Staten Island, NY 10304
|
1,340 sq. feet
|
- baths - beds |
show details | |

|
#48
Hampton Grn
Staten Island, NY 10312
|
1,480 sq. feet
|
- baths - beds |
show details | |

|
#49
Sky Ln
Staten Island, NY 10304
|
948 sq. feet
|
- baths - beds |
show details | |

|
Check over 1 million property listings on Foreclosure.com!
|
browse all offers | |||

Household type by relationship:
Households: 460,892- In family households: 405,089 (76,763 male householders, 41,788 female householders)
86,273 spouses, 154,934 children (148,489 natural, 2,476 adopted, 3,969 stepchildren), 8,483 grandchildren, 6,551 brothers or sisters, 8,229 parents, foster children, 8,126 other relatives, 9,060 non-relatives
- In nonfamily households: 55,803 (21,140 male householders (17,112 living alone)), 25,825 female householders (22,895 living alone)), 8,838 nonrelatives
- In group quarters: 7,838 (3,862 institutionalized population)
80,293 married couples with children.
23,460 single-parent households (3,680 men, 19,780 women).
74.0% of residents of Staten Island speak English at home.
9.0% of residents speak Spanish at home (63% speak English very well, 20% speak English well, 14% speak English not well, 4% don't speak English at all).
10.9% of residents speak other Indo-European language at home (65% speak English very well, 24% speak English well, 9% speak English not well, 2% don't speak English at all).
4.0% of residents speak Asian or Pacific Island language at home (52% speak English very well, 28% speak English well, 16% speak English not well, 4% don't speak English at all).
2.2% of residents speak other language at home (71% speak English very well, 20% speak English well, 8% speak English not well, 1% don't speak English at all).
Foreign born population: 127,780 (26.0%)
(68.9% of them are naturalized citizens)
| Here: | 6.1 |
| State: | 6.3 |
| Here: | 4.1 |
| State: | 3.8 |

- Bedrooms in owner-occupied houses and condos in Staten Island, New York
- 264no bedroom
- 4,2601 bedroom
- 17,0922 bedrooms
- 55,9393 bedrooms
- 16,9804 bedrooms
- 5,1975+ bedrooms

- Bedrooms in renter-occupied apartments in Staten Island, New York
- 3,756no bedroom
- 21,3541 bedroom
- 19,5312 bedrooms
- 10,2963 bedrooms
- 1,3434 bedrooms
- 3295+ bedrooms

- Cars and other vehicles available in Staten Island in owner-occupied houses/condos
- 7,288no vehicle
- 34,7961 vehicle
- 43,3622 vehicles
- 11,0173 vehicles
- 2,6594 vehicles
- 6105+ vehicles

- Cars and other vehicles available in Staten Island in renter-occupied apartments
- 21,403no vehicle
- 24,9871 vehicle
- 8,8372 vehicles
- 1,0063 vehicles
- 1604 vehicles
- 2165+ vehicles

- Rooms in owner-occupied houses in Staten Island, New York
- 1471 room
- 6012 rooms
- 3,2283 rooms
- 6,5564 rooms
- 15,3045 rooms
- 29,8606 rooms
- 19,4467 rooms
- 10,9938 rooms
- 13,5979+ rooms

- Rooms in renter-occupied apartments in Staten Island, New York
- 2,9531 room
- 5,4242 rooms
- 15,8263 rooms
- 14,9584 rooms
- 8,8175 rooms
- 5,5466 rooms
- 1,8397 rooms
- 5618 rooms
- 6859+ rooms


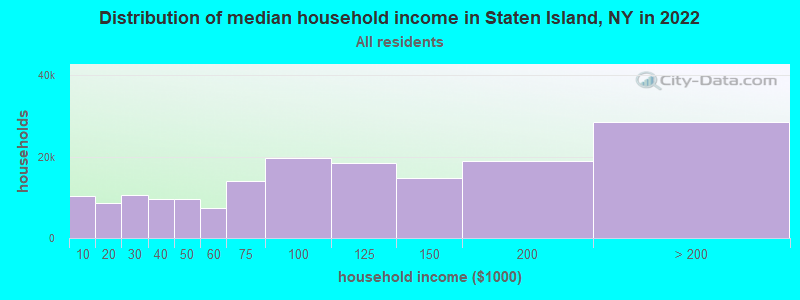
Staten Island, NY household income distribution

- 10,330Less than $10,000
- 8,667$10,000 to $19,999
- 10,468$20,000 to $29,999
- 9,462$30,000 to $39,999
- 9,677$40,000 to $49,999
- 7,389$50,000 to $59,999
- 13,896$60,000 to $74,999
- 19,655$75,000 to $99,999
- 18,418$100,000 to $124,999
- 14,648$125,000 to $149,999
- 18,850$150,000 to $199,999
- 28,486$200,000 or more
Percentage of workers working in this county: 55.5%
Number of people working at home: 23,286 (10.2% of all workers)
Travel time to work (commute)
- Less than 5 minutes: 2,400
- 5 to 9 minutes: 9,327
- 10 to 14 minutes: 17,849
- 15 to 19 minutes: 18,197
- 20 to 24 minutes: 18,075
- 25 to 29 minutes: 5,996
- 30 to 34 minutes: 20,396
- 35 to 39 minutes: 3,619
- 40 to 44 minutes: 8,344
- 45 to 59 minutes: 20,042
- 60 to 89 minutes: 37,768
- 90 or more minutes: 25,926
Means of transportation to work:
- Drove a car alone: 103,856 (54.3%)
- Carpooled: 23,084 (12.1%)
- Bus or trolley bus: 36,678 (19.2%)
- Streetcar or trolley car: 89 (0.0%)
- Subway or elevated: 4,894 (2.6%)
- Railroad: 1,705 (0.9%)
- Ferryboat: 10,109 (5.3%)
- Taxi: 715 (0.4%)
- Motorcycle: 114 (0.1%)
- Bicycle: 364 (0.2%)
- Walked: 5,545 (2.9%)
- Other means: 786 (0.4%)
- Worked at home: 3,206 (1.7%)


- Year of entry for the foreign-born population in Staten Island, New York
- 12,7991995 to March 2000
- 13,2811990 to 1994
- 10,7291985 to 1989
- 7,6731980 to 1984
- 6,0831975 to 1979
- 6,5411970 to 1974
- 5,1471965 to 1969
- 10,404Before 1965
Most common places of birth for foreign-born residents (%):
| Staten Island: | 11.3% (8,245) |
| New York: | 3.8% (147,729) |
| Staten Island: | 6.7% (4,890) |
| New York: | 4.2% (161,189) |
| Staten Island: | 5.2% (3,799) |
| New York: | 1.9% (72,408) |
| Staten Island: | 4.8% (3,499) |
| New York: | 3.0% (117,238) |
| Staten Island: | 4.8% (3,452) |
| New York: | 2.4% (94,595) |
| Staten Island: | 3.9% (2,828) |
| New York: | 6.0% (233,766) |
| Staten Island: | 3.7% (2,710) |
| New York: | 2.5% (97,933) |
| Staten Island: | 3.7% (2,654) |
| New York: | 1.4% (53,825) |
| Staten Island: | 3.1% (2,220) |
| New York: | 2.1% (82,238) |
| Staten Island: | 2.8% (2,058) |
| New York: | 2.4% (93,187) |
| Staten Island: | 2.8% (2,042) |
| New York: | 0.5% (17,599) |
| Staten Island: | 2.7% (1,981) |
| New York: | 0.5% (19,907) |
| Staten Island: | 2.5% (1,794) |
| New York: | 0.7% (25,688) |
| Staten Island: | 2.0% (1,433) |
| New York: | 0.5% (18,889) |
| Staten Island: | 1.9% (1,366) |
| New York: | 2.9% (111,727) |
| Staten Island: | 1.8% (1,325) |
| New York: | 1.3% (51,055) |
| Staten Island: | 1.8% (1,286) |
| New York: | 2.5% (98,473) |
| Staten Island: | 1.8% (1,285) |
| New York: | 10.5% (408,086) |
| Staten Island: | 1.7% (1,258) |
| New York: | 1.0% (37,496) |
| Staten Island: | 1.6% (1,191) |
| New York: | 5.9% (226,470) |
| Staten Island: | 1.6% (1,152) |
| New York: | 0.6% (23,797) |
Place of birth for U.S.-born residents:
- This state: 335,402
- Other state: 26,543
- Northeast: 13,141
- Midwest: 3,067
- South: 8,306
- West: 2,029
65% of Staten Island residents lived in the same house 5 years ago.
Out of people who lived in different houses, 59% lived in this county.
Out of people who lived in different counties, 83% lived in New York.
Education attainment for males 25 years and older:
- No schooling: 1,771
- Nursery to 4th grade: 585
- 5th and 6th grade: 1,642
- 7th and 8th grade: 3,087
- 9th grade: 2,357
- 10th grade: 3,341
- 11th grade: 3,699
- 12th grade, no diploma: 6,993
- High school graduate (or equivalency): 43,032
- Less than 1 year of college: 9,196
- Some college more than 1 year, no degree: 19,957
- Associate degree: 7,646
- Bachelor's degree: 21,553
- Master's degree: 7,772
- Professional school degree: 3,756
- Doctorate degree: 1,018

Education attainment for females 25 years and older:
- No schooling: 2,035
- Nursery to 4th grade: 732
- 5th and 6th grade: 2,187
- 7th and 8th grade: 4,311
- 9th grade: 2,564
- 10th grade: 3,729
- 11th grade: 4,194
- 12th grade, no diploma: 7,936
- High school graduate (or equivalency): 55,813
- Less than 1 year of college: 9,954
- Some college more than 1 year, no degree: 18,319
- Associate degree: 10,601
- Bachelor's degree: 19,964
- Master's degree: 11,118
- Professional school degree: 2,355
- Doctorate degree: 578


Housing units in structures:
- One, detached: 55,398
- One, attached: 39,674
- Two: 37,788
- 3 or 4: 8,154
- 5 to 9: 3,953
- 10 to 19: 2,693
- 20 to 49: 4,680
- 50 or more: 11,319
- Mobile homes: 278
- Boats, RVs, vans, etc.: 56
Median worth of mobile homes: $145,815
Housing units lacking complete kitchen facilities: 0.6%

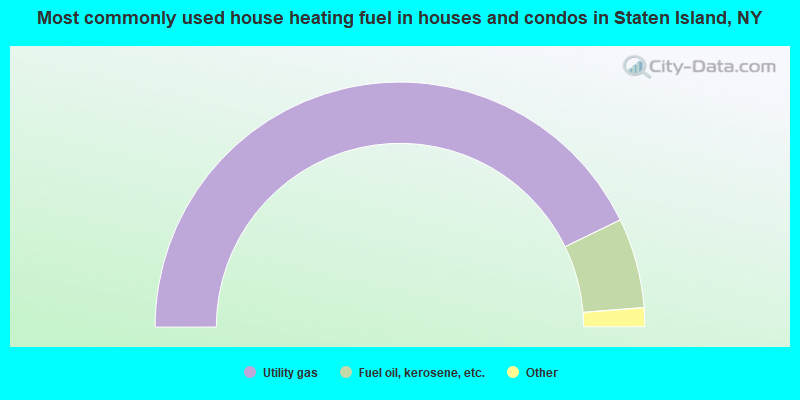
- 85.6%Utility gas
- 11.9%Fuel oil, kerosene, etc.
- 1.3%Electricity
- 1.0%Bottled, tank, or LP gas
- 0.1%Other fuel
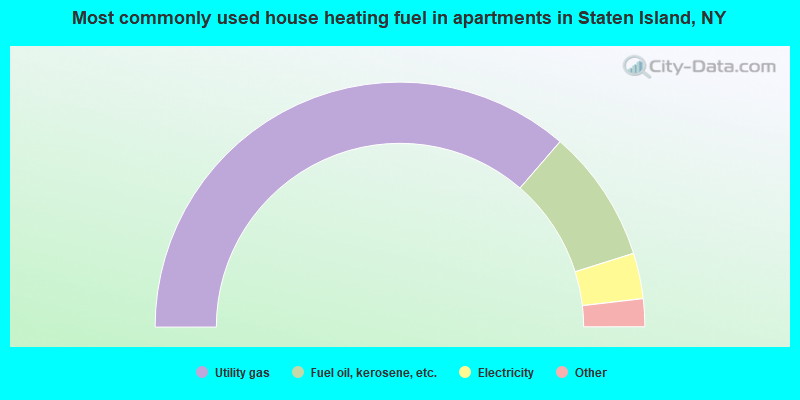
- 72.7%Utility gas
- 17.6%Fuel oil, kerosene, etc.
- 6.0%Electricity
- 1.7%Bottled, tank, or LP gas
- 1.0%Other fuel
- 1.0%No fuel used
Private vs. public school enrollment:
| Here: | 23.3% |
| New York: | 14.0% |
| Here: | 26.7% |
| New York: | 13.2% |
| Here: | 38.9% |
| New York: | 38.2% |


