St. Charles, MO (Missouri) Houses and Residents
Estimated median house or condo value in 2022: $289,600 (it was $113,800 in 2000 )
St. Charles:
$289,600Missouri:
$221,200
Lower value quartile - upper value quartile: $187,700 - $393,800Mean price in 2022: Detached houses: $347,054 Here:
$347,054State:
$278,068
Townhouses or other attached units: $263,527 Here:
$263,527State:
$260,773
In 2-unit structures: $322,858 Here:
$322,858State:
$172,667
In 3-to-4-unit structures: $166,174 Here:
$166,174State:
$181,162
In 5-or-more-unit structures: $171,504 Here:
$171,504State:
$263,082
Mobile homes: $49,780 Here:
$49,780State:
$95,912
Total population: 68,090 (Urban population: 59,946, Rural population: 51 (all nonfarm) )
Houses: 33,281 (31,424 occupied: 21,362 owner occupied, 10,062 renter occupied )
% of renters here:
32%State:
32%
Housing density: 1,634 houses/condos per square mile
Median price asked for vacant for-sale houses and condos in 2022: $116,018.
Median contract rent in 2022: $962 (lower quartile is $768, upper quartile is $1,233)
Median rent asked for vacant for-rent units in 2022: $1,247
Median gross rent in St. Charles, MO in 2022: $1,100
Housing units in St. Charles with a mortgage: 13,589 (1,199 second mortgage, 0 home equity loan, 1,199 both second mortgage and home equity loan )Houses without a mortgage: 180
Median household income for houses/condos with a mortgage: $119,945
Median household income for apartments without a mortgage: $66,615
Median monthly housing costs: $1,179
Data:
Median house or condo value ($)
Median house or condo value ($ change since 2000)
Median house or condo value ($) - White
Median house or condo value ($) - Black or African American
Median house or condo value ($) - Asian
Median house or condo value ($) - Hispanic or Latino
Median house or condo value ($) - American Indian and Alaska Native
Median house or condo value ($) - Multirace
Median house or condo value ($) - Other Race
Median price asked for mobile homes ($)
Household density (households per square mile)
Mean house or condo value by units in structure - 1, detached ($)
Mean house or condo value by units in structure - 1, attached ($)
Mean house or condo value by units in structure - 2 ($)
Mean house or condo value by units in structure by units in structure - 3 or 4 ($)
Mean house or condo value by units in structure - 5 or more ($)
Mean house or condo value by units in structure - Boat, RV, van, etc. ($)
Mean house or condo value by units in structure - Mobile home ($)
Median contract rent ($)
Median contract rent - Lower quartile ($)
Median contract rent - Upper quartile ($)
Median gross rent ($)
Urban houses (%)
Rural houses (%)
Houses occupied (%)
Houses occupied (% change since 2000)
Houses owner occupied (%)
Houses owner occupied (% change since 2000)
Houses renter occupied (%)
Houses renter occupied (% change since 2000)
Vacant housing units - For rent (%)
Vacant housing units - For rent (% change since 2000)
Vacant housing units - For sale only (%)
Vacant housing units - For sale only (% change since 2000)
Vacant housing units - Rented or sold, not occupied (%)
Vacant housing units - Rented or sold, not occupied (% change since 2000)
Vacant housing units - For seasonal, recreational, or occasional use (%)
Vacant housing units - For seasonal, recreational, or occasional use (% change since 2000)
Vacant housing units - For migrant workers (%)
Vacant housing units - For migrant workers (% change since 2000)
Vacant housing units - Other vacant (%)
Vacant housing units - Other vacant (% change since 2000)
Median monthly housing costs ($)
Median household income for houses/condos with a mortgage ($)
Median household income for houses/condos without a mortgage ($)
Median household income ($)
Median household income ($) - White
Median household income ($) - Black or African American
Median household income ($) - Asian
Median household income ($) - Hispanic or Latino
Median household income ($) - American Indian and Alaska Native
Median household income ($) - Multirace
Median household income ($) - Other Race
Mortgage status - with mortgage (%)
Mortgage status - with second mortgage (%)
Mortgage status - with home equity loan (%)
Mortgage status - with both second mortgage and home equity loan (%)
Mortgage status - without a mortgage (%)
Median year house/condo built
Median year apartment built
Household type by relationship - Male householder living alone (%)
Household type by relationship - Male householder not living alone (%)
Household type by relationship - Female householder living alone (%)
Household type by relationship - Female householder not living alone (%)
Household type by relationship - Opposite-Sex spouse (%)
Household type by relationship - Same-Sex spouse (%)
Household type by relationship - Opposite-Sex unmarried partner (%)
Household type by relationship - Same-Sex unmarried partner (%)
Household type by relationship - In group quarters (%)
Size of family households - 2-person household (%)
Size of family households - 3-person household (%)
Size of family households - 4-person household (%)
Size of family households - 5-person household (%)
Size of family households - 6-person household (%)
Size of family households - 7-or-more-person household (%)
Size of nonfamily households - 1-person household (%)
Size of nonfamily households - 2-person household (%)
Size of nonfamily households - 3-person household (%)
Size of nonfamily households - 4-person household (%)
Size of nonfamily households - 5-person household (%)
Size of nonfamily households - 6-person household (%)
Size of nonfamily households - 7-or-moreperson household (%)
Year house built - Built 2010 or later (%)
Year house built - Built 2000 to 2009 (%)
Year house built - Built 1990 to 1999 (%)
Year house built - Built 1980 to 1989 (%)
Year house built - Built 1970 to 1979 (%)
Year house built - Built 1960 to 1969 (%)
Year house built - Built 1950 to 1959 (%)
Year house built - Built 1940 to 1949 (%)
Year house built - Built 1939 or earlier (%)
Median number of rooms in houses and condos
Median number of rooms in apartments
Median number of bedrooms in owner occupied houses
Mean number of bedrooms in owner occupied houses
Median number of bedrooms in renter occupied houses
Mean number of bedrooms in renter occupied houses
Median number of vehichles in owner occupied houses
Mean number of vehichles in owner occupied houses
Median number of vehichles in renter occupied houses
Mean number of vehichles in renter occupied houses
Rooms in owner-occupied houses - 1 room (%)
Rooms in owner-occupied houses - 2 rooms (%)
Rooms in owner-occupied houses - 3 rooms (%)
Rooms in owner-occupied houses - 4 rooms (%)
Rooms in owner-occupied houses - 5 rooms (%)
Rooms in owner-occupied houses - 6 rooms (%)
Rooms in owner-occupied houses - 7 rooms (%)
Rooms in owner-occupied houses - 8 rooms (%)
Rooms in owner-occupied houses - 9+ rooms (%)
Rooms in renter-occupied houses - 1 room (%)
Rooms in renter-occupied houses - 2 rooms (%)
Rooms in renter-occupied houses - 3 rooms (%)
Rooms in renter-occupied houses - 4 rooms (%)
Rooms in renter-occupied houses - 5 rooms (%)
Rooms in renter-occupied houses - 6 rooms (%)
Rooms in renter-occupied houses - 7 rooms (%)
Rooms in renter-occupied houses - 8 rooms (%)
Rooms in renter-occupied houses - 9+ rooms (%)
Bedrooms in owner-occupied houses - no bedrooms (%)
Bedrooms in owner-occupied houses - 1 bedroom (%)
Bedrooms in owner-occupied houses - 2 bedrooms (%)
Bedrooms in owner-occupied houses - 3 bedrooms (%)
Bedrooms in owner-occupied houses - 4 bedrooms (%)
Bedrooms in owner-occupied houses - 5+ bedrooms (%)
Bedrooms in renter-occupied houses - no bedrooms (%)
Bedrooms in renter-occupied houses - 1 bedroom (%)
Bedrooms in renter-occupied houses - 2 bedrooms (%)
Bedrooms in renter-occupied houses - 3 bedrooms (%)
Bedrooms in renter-occupied houses - 4 bedrooms (%)
Bedrooms in renter-occupied houses - 5+ bedrooms (%)
Vehicles available in owner-occupied houses - no vehicle available (%)
Vehicles available in owner-occupied houses - 1 vehicle available(%)
Vehicles available in owner-occupied houses - 2 Vehicles available (%)
Vehicles available in owner-occupied houses - 3 Vehicles available (%)
Vehicles available in owner-occupied houses - 4 Vehicles available (%)
Vehicles available in owner-occupied houses - 5+ Vehicles available (%)
Vehicles available in renter-occupied houses - no vehicle available (%)
Vehicles available in renter-occupied houses - 1 vehicle available (%)
Vehicles available in renter-occupied houses - 2 Vehicles available (%)
Vehicles available in renter-occupied houses - 3 Vehicles available (%)
Vehicles available in renter-occupied houses - 4 Vehicles available (%)
Vehicles available in renter-occupied houses - 5+ Vehicles available (%)
Housing units in structures - 1, detached (%)
Housing units in structures - 1, attached (%)
Housing units in structures - 2 (%)
Housing units in structures - 3 or 4 (%)
Housing units in structures - 5 to 9 (%)
Housing units in structures - 10 to 19 (%)
Housing units in structures - 20 to 49 (%)
Housing units in structures - 50 or more (%)
Housing units in structures - Mobile home (%)
Housing units in structures - Boat, RV, van, etc. (%)
Housing units in structures - Owners - 1, detached (%)
Housing units in structures - Owners - 1, attached (%)
Housing units in structures - Owners - 2 (%)
Housing units in structures - Owners - 3 or 4 (%)
Housing units in structures - Owners - 5 to 9 (%)
Housing units in structures - Owners - 10 to 19 (%)
Housing units in structures - Owners - 20 to 49 (%)
Housing units in structures - Owners - 50 or more (%)
Housing units in structures - Owners - Mobile home (%)
Housing units in structures - Owners - Boat, RV, van, etc. (%)
Housing units in structures - Renters - 1, detached (%)
Housing units in structures - Renters - 1, attached (%)
Housing units in structures - Renters - 2 (%)
Housing units in structures - Renters - 3 or 4 (%)
Housing units in structures - Renters - 5 to 9 (%)
Housing units in structures - Renters - 10 to 19 (%)
Housing units in structures - Renters - 20 to 49 (%)
Housing units in structures - Renters - 50 or more (%)
Housing units in structures - Renters - Mobile home (%)
Housing units in structures - Renters - Boat, RV, van, etc. (%)
House/condo owner moved in on average (years ago)
Renter moved in on average (years ago)
Year householder moved into unit - Moved in 1999 to March 2000 (%)
Year householder moved into unit - Moved in 1999 to March 2000 (%) - White
Year householder moved into unit - Moved in 1999 to March 2000 (%) - Black or African American
Year householder moved into unit - Moved in 1999 to March 2000 (%) - Asian
Year householder moved into unit - Moved in 1999 to March 2000 (%) - Hispanic or Latino
Year householder moved into unit - Moved in 1999 to March 2000 (%) - American Indian and Alaska Native
Year householder moved into unit - Moved in 1999 to March 2000 (%) - Multirace
Year householder moved into unit - Moved in 1999 to March 2000 (%) - Other Race
Year householder moved into unit - Moved in 1995 to 1998 (%)
Year householder moved into unit - Moved in 1995 to 1998 (%) - White
Year householder moved into unit - Moved in 1995 to 1998 (%) - Black or African American
Year householder moved into unit - Moved in 1995 to 1998 (%) - Asian
Year householder moved into unit - Moved in 1995 to 1998 (%) - Hispanic or Latino
Year householder moved into unit - Moved in 1995 to 1998 (%) - American Indian and Alaska Native
Year householder moved into unit - Moved in 1995 to 1998 (%) - Multirace
Year householder moved into unit - Moved in 1995 to 1998 (%) - Other Race
Year householder moved into unit - Moved in 1990 to 1994 (%)
Year householder moved into unit - Moved in 1990 to 1994 (%) - White
Year householder moved into unit - Moved in 1990 to 1994 (%) - Black or African American
Year householder moved into unit - Moved in 1990 to 1994 (%) - Asian
Year householder moved into unit - Moved in 1990 to 1994 (%) - Hispanic or Latino
Year householder moved into unit - Moved in 1990 to 1994 (%) - American Indian and Alaska Native
Year householder moved into unit - Moved in 1990 to 1994 (%) - Multirace
Year householder moved into unit - Moved in 1990 to 1994 (%) - Other Race
Year householder moved into unit - Moved in 1980 to 1989 (%)
Year householder moved into unit - Moved in 1980 to 1989 (%) - White
Year householder moved into unit - Moved in 1980 to 1989 (%) - Black or African American
Year householder moved into unit - Moved in 1980 to 1989 (%) - Asian
Year householder moved into unit - Moved in 1980 to 1989 (%) - Hispanic or Latino
Year householder moved into unit - Moved in 1980 to 1989 (%) - American Indian and Alaska Native
Year householder moved into unit - Moved in 1980 to 1989 (%) - Multirace
Year householder moved into unit - Moved in 1980 to 1989 (%) - Other Race
Year householder moved into unit - Moved in 1970 to 1979 (%)
Year householder moved into unit - Moved in 1970 to 1979 (%) - White
Year householder moved into unit - Moved in 1970 to 1979 (%) - Black or African American
Year householder moved into unit - Moved in 1970 to 1979 (%) - Asian
Year householder moved into unit - Moved in 1970 to 1979 (%) - Hispanic or Latino
Year householder moved into unit - Moved in 1970 to 1979 (%) - American Indian and Alaska Native
Year householder moved into unit - Moved in 1970 to 1979 (%) - Multirace
Year householder moved into unit - Moved in 1970 to 1979 (%) - Other Race
Year householder moved into unit - Moved in 1969 or earlier (%)
Year householder moved into unit - Moved in 1969 or earlier (%) - White
Year householder moved into unit - Moved in 1969 or earlier (%) - Black or African American
Year householder moved into unit - Moved in 1969 or earlier (%) - Asian
Year householder moved into unit - Moved in 1969 or earlier (%) - Hispanic or Latino
Year householder moved into unit - Moved in 1969 or earlier (%) - American Indian and Alaska Native
Year householder moved into unit - Moved in 1969 or earlier (%) - Multirace
Year householder moved into unit - Moved in 1969 or earlier (%) - Other Race
Housing units lacking complete plumbing facilities (%)
Housing units lacking complete kitchen facilities (%)
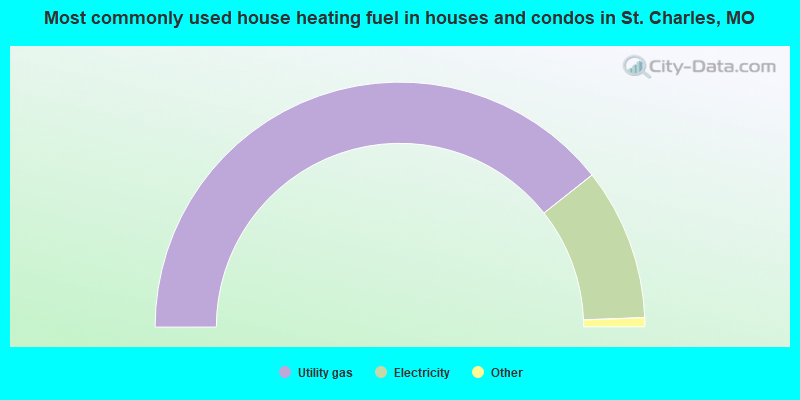
House heating fuel used in houses and condos - Utility gas (%)
House heating fuel used in houses and condos - Bottled, tank, or LP gas (%)
House heating fuel used in houses and condos - Electricity (%)
House heating fuel used in houses and condos - Fuel oil, kerosene, etc. (%)
House heating fuel used in houses and condos - Coal or coke (%)
House heating fuel used in houses and condos - Wood (%)
House heating fuel used in houses and condos - Solar energy (%)
House heating fuel used in houses and condos - Other fuel (%)
House heating fuel used in houses and condos - No fuel used (%)
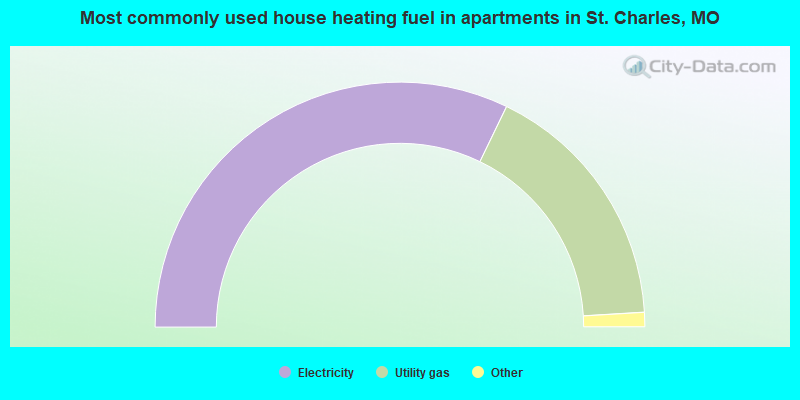
House heating fuel used in apartments - Utility gas (%)
House heating fuel used in apartments - Bottled, tank, or LP gas (%)
House heating fuel used in apartments - Electricity (%)
House heating fuel used in apartments - Fuel oil, kerosene, etc. (%)
House heating fuel used in apartments - Coal or coke (%)
House heating fuel used in apartments - Wood (%)
House heating fuel used in apartments - Solar energy (%)
House heating fuel used in apartments - Other fuel (%)
House heating fuel used in apartments - No fuel used (%)
Median year house/condo built: 1990Median year apartment built: 1981Household type by relationship:
Households: 71,190
Male householders: 15,544 (5,048 living alone ), Female householders: 15,880 (5,793 living alone )14,304 spouses (14,209 opposite-sex spouses ), 2,347 unmarried partners , (2,316 opposite-sex unmarried partners ), 14,792 children (14,387 natural , 129 adopted , 276 stepchildren ), 540 grandchildren , 505 brothers or sisters , 508 parents , 0 foster children , 257 other relatives , 1,624 non-relatives In group quarters: 4,889
Size of family households: 9,935 2-persons , 3,698 3-persons , 3,015 4-persons , 1,091 5-persons , 378 6-persons , 143 7-or-more-persons .
Size of nonfamily households: 10,119 1-person , 2,251 2-persons , 226 3-persons , 73 4-persons .
8,372 married couples with children. single-parent households (1,090 men , 1,594 women ).
92.5% of residents of St. Charles speak English at home. of residents speak Spanish at home (68% speak English very well , 19% speak English well , 11% speak English not well , 2% don't speak English at all ).of residents speak other Indo-European language at home (76% speak English very well , 17% speak English well , 7% speak English not well ).of residents speak Asian or Pacific Island language at home (71% speak English very well , 21% speak English well , 4% speak English not well , 3% don't speak English at all ).of residents speak other language at home (77% speak English very well , 5% speak English well , 15% speak English not well , 4% don't speak English at all ).
Foreign born population: 3,684 (5.2%)of them are naturalized citizens )
Median number of rooms in houses and condos:
Median number of rooms in apartments
Owner-occupied Renter-occupied
Bedrooms in owner-occupied houses and condos in St. Charles, Missouri
274 no bedroom 329 1 bedroom 2,994 2 bedrooms 9,926 3 bedrooms 6,599 4 bedrooms 1,240 5+ bedrooms
Bedrooms in renter-occupied apartments in St. Charles, Missouri
1,029 no bedroom 2,718 1 bedroom 4,459 2 bedrooms 1,135 3 bedrooms 721 4 bedrooms 0 5+ bedrooms
Owner-occupied Renter-occupied
Rooms in owner-occupied houses in St. Charles, Missouri
274 1 room 0 2 rooms 776 3 rooms 1,572 4 rooms 4,331 5 rooms 4,146 6 rooms 2,856 7 rooms 2,611 8 rooms 4,796 9+ rooms
Rooms in renter-occupied apartments in St. Charles, Missouri
959 1 room 746 2 rooms 2,357 3 rooms 2,624 4 rooms 2,085 5 rooms 605 6 rooms 271 7 rooms 217 8 rooms 198 9+ rooms
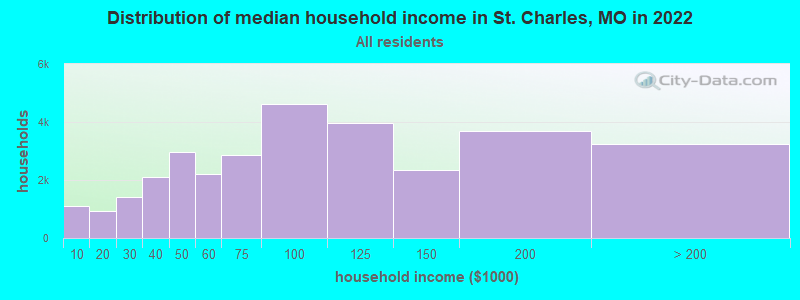
St. Charles, MO household income distribution 1,118 Less than $10,000920 $10,000 to $19,9991,407 $20,000 to $29,9992,097 $30,000 to $39,9992,961 $40,000 to $49,9992,201 $50,000 to $59,9992,878 $60,000 to $74,9994,624 $75,000 to $99,9993,955 $100,000 to $124,9992,329 $125,000 to $149,9993,689 $150,000 to $199,9993,245 $200,000 or more
Home value of owner - occupied houses in 2022 in St. Charles, MO 524 Less than $10,000242 $10,000 to $14,99975 $15,000 to $19,999188 $20,000 to $24,999109 $25,000 to $29,99925 $30,000 to $34,99925 $35,000 to $39,99950 $40,000 to $49,99964 $50,000 to $59,99959 $60,000 to $69,99920 $70,000 to $79,999131 $80,000 to $89,99953 $90,000 to $99,999278 $100,000 to $124,999488 $125,000 to $149,9991,154 $150,000 to $174,9991,447 $175,000 to $199,9993,050 $200,000 to $249,9992,951 $250,000 to $299,9994,597 $300,000 to $399,9992,281 $400,000 to $499,9991,363 $500,000 to $749,999351 $750,000 to $999,99961 $1,000,000 to $1,499,99930 $1,500,000 to $1,999,999156 $2,000,000 or moreRent paid by renters in 2022 in St. Charles, MO 184 Less than $10085 $100 to $149168 $150 to $199129 $200 to $24939 $250 to $29995 $300 to $34922 $350 to $39957 $400 to $44973 $450 to $49968 $500 to $549126 $550 to $599545 $600 to $649393 $650 to $699507 $700 to $749507 $750 to $7991,289 $800 to $8991,646 $900 to $9992,345 $1,000 to $1,2491,173 $1,250 to $1,499986 $1,500 to $1,99998 $2,000 to $2,49993 $2,500 to $2,99976 $3,000 to $3,49934 $3,500 or more313 No cash rent
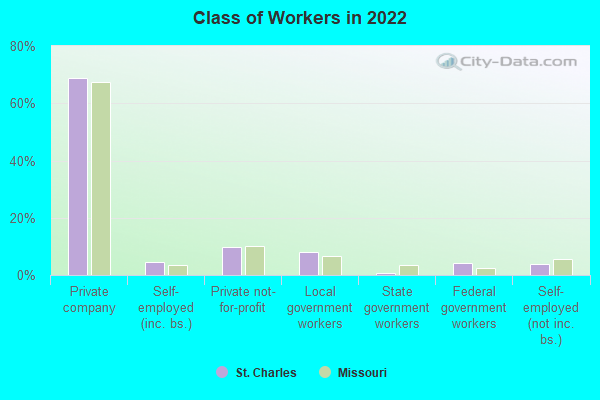
Percentage of workers working in this county: 55.8%Number of people working at home: 6,540 (17.3% of all workers )
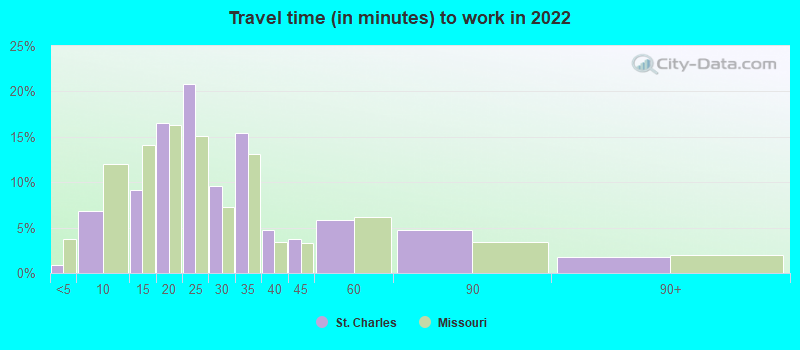
Travel time to work (commute)
Less than 5 minutes: 2755 to 9 minutes: 2,86910 to 14 minutes: 4,96715 to 19 minutes: 5,87820 to 24 minutes: 5,99925 to 29 minutes: 2,32930 to 34 minutes: 4,36935 to 39 minutes: 1,35940 to 44 minutes: 90545 to 59 minutes: 1,39160 to 89 minutes: 31790 or more minutes: 633
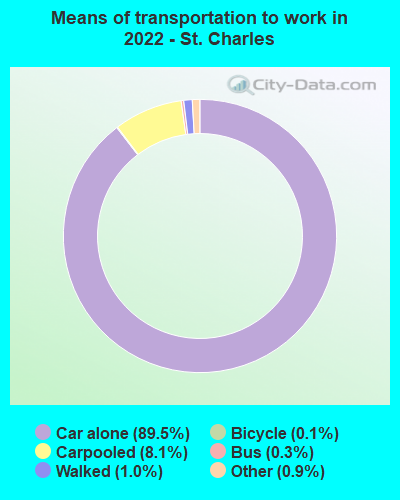
Means of transportation to work:
Drove a car alone: 34,170 (74.6%)Carpooled: 3,556 (7.8%)Bus : 104 (0.2%)Light rail, streetcar or trolley : 9 (0.0%)Ferryboat: 2 (0.0%)Taxi: 314 (0.7%)Bicycle: 26 (0.1%)Walked: 525 (1.1%)Worked at home: 6,455 (14.1%)
Unemployment by race in 2022
Unemployment rate for White non-Hispanic residents 2.2% Males4.3% FemalesUnemployment rate for Black residents 3.3% Males6.1% FemalesUnemployment rate for American Indian and Alaska Native residents 5.5% FemalesUnemployment rate for two or more race residents 5.8% Males0.9% FemalesUnemployment rate for Hispanic or Latino residents 0.6% Males
Year of entry for the foreign-born population in St. Charles, Missouri
1,822 2010 or later 998 2000 to 2009 527 1990 to 1999 287 1980 to 1989 152 1970 to 1979 326 Before 1970
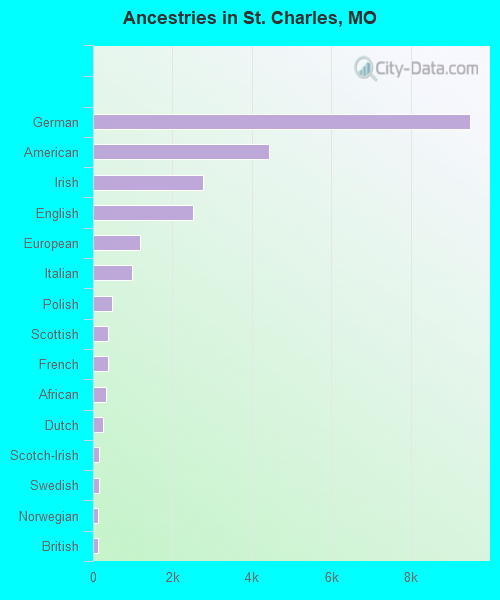
First ancestries reported:
German: 9,495 (26.9%)
American: 4,432 (12.5%)
Irish: 2,781 (7.9%)
English: 2,514 (7.1%)
European: 1,189 (3.4%)
Italian: 975 (2.8%)
Polish: 474 (1.3%)
Scottish: 377 (1.1%)
French: 370 (1.0%)
African: 335 (0.9%)
Dutch: 260 (0.7%)
Scotch-Irish: 159 (0.5%)
Swedish: 156 (0.4%)
Norwegian: 136 (0.4%)
British: 120 (0.3%)
Northern European: 84 (0.2%)
Belgian: 82 (0.2%)
Greek: 80 (0.2%)
Armenian: 77 (0.2%)
Egyptian: 67 (0.2%)
Czech: 65 (0.2%)
Canadian: 62 (0.2%)
Eastern European: 59 (0.2%)
Austrian: 58 (0.2%)
Brazilian: 58 (0.2%)
Yugoslavian: 58 (0.2%)
Scandinavian: 57 (0.2%)
Russian: 44 (0.1%)
Croatian: 42 (0.1%)
Swiss: 41 (0.1%)
Cajun: 40 (0.1%)
Palestinian: 36 (0.1%)
Lebanese: 33 (0.09%)
French Canadian: 33 (0.09%)
Welsh: 25 (0.07%)
Czechoslovakian: 22 (0.06%)
Romanian: 22 (0.06%)
Sudanese: 22 (0.06%)
Albanian: 21 (0.06%)
Portuguese: 19 (0.05%)
Danish: 17 (0.05%)
Finnish: 16 (0.05%)
Hungarian: 15 (0.04%)
Macedonian: 14 (0.04%)
Trinidadian and Tobagonian: 14 (0.04%)
Jordanian: 12 (0.03%)
Jamaican: 12 (0.03%)
Slovene: 11 (0.03%)
Iranian: 8 (0.02%)
Nigerian: 7 (0.02%)
Latvian: 4 (0.01%)
New Zealander: 3 (0.01%)
Slovak: 3 (0.01%)
Most common places of birth for foreign-born residents (%): Mexico St. Charles:
14.0% (531)Missouri:
14.9% (38,568)
India St. Charles:
13.9% (529)Missouri:
8.9% (22,932)
Philippines St. Charles:
6.8% (257)Missouri:
4.2% (10,873)
Guatemala St. Charles:
6.7% (253)Missouri:
2.8% (7,146)
Honduras St. Charles:
4.4% (166)Missouri:
2.1% (5,346)
Korea St. Charles:
3.9% (149)Missouri:
2.9% (7,525)
Pakistan St. Charles:
3.5% (132)Missouri:
1.2% (3,209)
China, excluding Hong Kong and Taiwan St. Charles:
3.1% (116)Missouri:
6.6% (17,002)
Canada St. Charles:
3.0% (115)Missouri:
1.9% (4,806)
Costa Rica St. Charles:
2.9% (110)Missouri:
0.2% (567)
England St. Charles:
2.5% (96)Missouri:
1.1% (2,796)
Brazil St. Charles:
2.5% (95)Missouri:
0.7% (1,861)
Vietnam St. Charles:
2.4% (93)Missouri:
4.1% (10,700)
Panama St. Charles:
2.4% (92)Missouri:
0.3% (683)
Thailand St. Charles:
2.2% (85)Missouri:
1.0% (2,597)
Japan St. Charles:
2.0% (76)Missouri:
0.7% (1,818)
Other South Central Asia St. Charles:
1.7% (65)Missouri:
0.1% (200)
Place of birth for U.S.-born residents:
This state: 44,784Other state: 20,874Northeast: 1,416Midwest: 11,936South: 4,513West: 3,009 87.2% of St. Charles residents lived in the same house 1 years ago.
Out of people who lived in different houses, 24.1% lived in this county.
Out of people who lived in different counties, 64.6% lived in Missouri.
St. Charles:
87.2%State average:
87.1%
Education attainment for males 25 years and older:
No schooling: 439Nursery to 4th grade: 05th and 6th grade: 07th and 8th grade: 1249th grade: 12910th grade: 2211th grade: 13512th grade, no diploma: 139High school graduate (or equivalency): 6,371Less than 1 year of college: 1,529Some college more than 1 year, no degree: 3,740Associate degree: 2,006Bachelor's degree: 6,752Master's degree: 2,381Professional school degree: 472Doctorate degree: 531
Education attainment for females 25 years and older:
No schooling: 501Nursery to 4th grade: 05th and 6th grade: 2447th and 8th grade: 959th grade: 5510th grade: 24011th grade: 28612th grade, no diploma: 66High school graduate (or equivalency): 4,416Less than 1 year of college: 1,684Some college more than 1 year, no degree: 3,351Associate degree: 2,458Bachelor's degree: 7,692Master's degree: 3,452Professional school degree: 296Doctorate degree: 297
Housing units in structures:
One, detached: 19,070One, attached: 2,675Two: 7243 or 4: 2,2035 to 9: 2,02710 to 19: 2,65320 to 49: 1,00050 or more: 1,149Mobile homes: 1,780Median worth of mobile homes: $19,132
Housing units lacking complete plumbing facilities in 2022: 0.4%Housing units lacking complete kitchen facilities in 2022: 0.4%House/condo owner moved in on average 10 years ago
Renter moved in on average 2 years ago
Private vs. public school enrollment:
Students in private schools in grades 1 to 8 (elementary and middle school): 804 Students in private schools in grades 9 to 12 (high school): 337 Students in private undergraduate colleges: 2,938