Housing density: 2,906 houses/condos per square mile
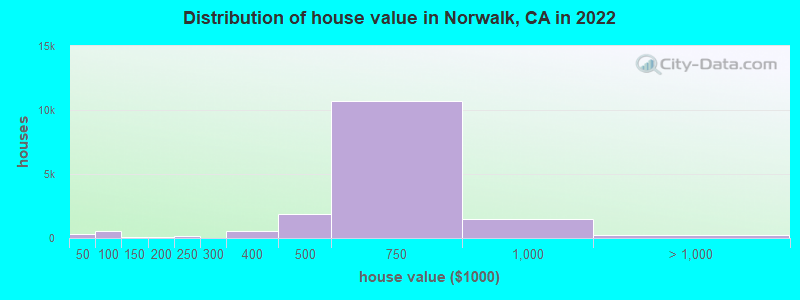
Median price asked for vacant for-sale houses and condos in 2022: $577,942.
Median contract rent in 2022: $1,721 (lower quartile is $1,389, upper quartile is over $2,000)
Median rent asked for vacant for-rent units in 2022: $1,556
Median gross rent in Norwalk, CA in 2022: $1,800
Housing units in Norwalk with a mortgage: 13,573 (761 second mortgage, 152 home equity loan, 609 both second mortgage and home equity loan) Houses without a mortgage: 246
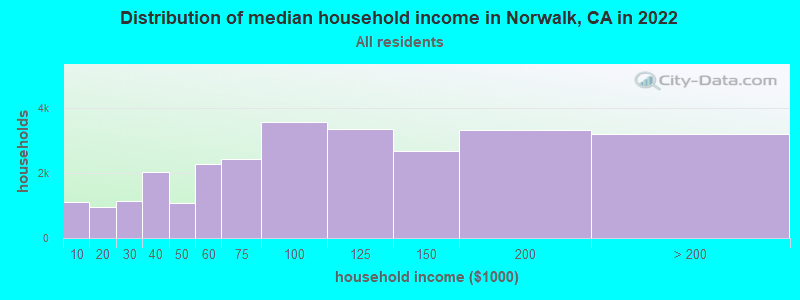
Median household income for houses/condos with a mortgage: $117,588
Median household income for apartments without a mortgage: $96,434
9,758 married couples with children.
4,889 single-parent households (1,324 men, 3,565 women).
36.2% of residents of Norwalk speak English at home.
51.4% of residents speak Spanish at home (65% speak English very well, 16% speak English well, 13% speak English not well, 6% don't speak English at all).
2.4% of residents speak other Indo-European language at home (76% speak English very well, 15% speak English well, 7% speak English not well, 3% don't speak English at all).
9.6% of residents speak Asian or Pacific Island language at home (57% speak English very well, 24% speak English well, 18% speak English not well, 1% don't speak English at all).
0.2% of residents speak other language at home (62% speak English very well, 12% speak English well, 5% speak English not well, 21% don't speak English at all).
Foreign born population: 36,689 (37.2%)
(64.3% of them are naturalized citizens)
Percentage of workers working in this county: 81.6% Number of people working at home: 5,355 (11.4% of all workers)
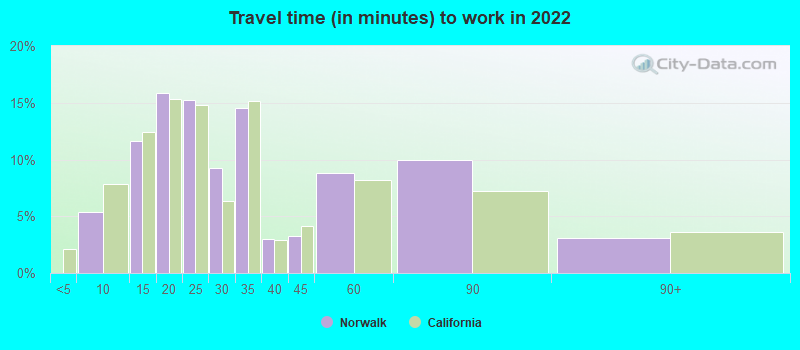
Travel time to work (commute)
Less than 5 minutes: 279
5 to 9 minutes: 1,895
10 to 14 minutes: 4,120
15 to 19 minutes: 7,237
20 to 24 minutes: 5,975
25 to 29 minutes: 3,336
30 to 34 minutes: 7,875
35 to 39 minutes: 1,544
40 to 44 minutes: 1,767
45 to 59 minutes: 3,532
60 to 89 minutes: 3,164
90 or more minutes: 916
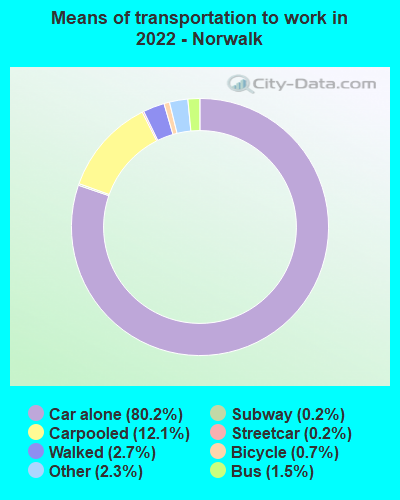
Means of transportation to work:
Drove a car alone: 19,513 (68.7%)
Carpooled: 3,254 (11.5%)
Bus: 333 (1.2%)
Subway or elevated rail: 42 (0.1%)
Long-distance train or commuter rail: 30 (0.1%)
Light rail, streetcar or trolley: 8 (0.0%)
Taxi: 619 (2.2%)
Bicycle: 181 (0.6%)
Walked: 696 (2.5%)
Worked at home: 3,547 (12.5%)
Unemployment by race in 2022
Unemployment rate for White non-Hispanic residents
4.6%Males
1.8%Females
Unemployment rate for Black residents
4.2%Males
4.6%Females
Unemployment rate for American Indian and Alaska Native residents
16.0%Males
7.5%Females
Unemployment rate for Asian residents
1.6%Males
0.8%Females
Unemployment rate for other race residents
4.0%Males
7.1%Females
Unemployment rate for two or more race residents
7.4%Males
1.6%Females
Unemployment rate for Hispanic or Latino residents
4.9%Males
5.3%Females
Year of entry for the foreign-born population in Norwalk, California
4,2742010 or later
5,5382000 to 2009
6,0001990 to 1999
13,6161980 to 1989
9,2621970 to 1979
3,835Before 1970
First ancestries reported:
American: 1,745 (2.6%)
Portuguese: 328 (0.5%)
Irish: 324 (0.5%)
English: 318 (0.5%)
German: 294 (0.4%)
Italian: 231 (0.3%)
European: 205 (0.3%)
African: 187 (0.3%)
Barbadian: 174 (0.3%)
Nigerian: 132 (0.2%)
Dutch: 110 (0.2%)
Swedish: 107 (0.2%)
Iranian: 79 (0.1%)
Scottish: 75 (0.1%)
Lebanese: 65 (0.10%)
Czechoslovakian: 64 (0.09%)
French: 64 (0.09%)
Russian: 48 (0.07%)
German Russian: 42 (0.06%)
Norwegian: 40 (0.06%)
Jamaican: 40 (0.06%)
Greek: 36 (0.05%)
French Canadian: 35 (0.05%)
Armenian: 33 (0.05%)
Hungarian: 31 (0.05%)
Sierra Leonean: 30 (0.04%)
Egyptian: 29 (0.04%)
Danish: 17 (0.03%)
Welsh: 17 (0.03%)
British: 12 (0.02%)
Canadian: 12 (0.02%)
Belizean: 11 (0.02%)
Czech: 10 (0.01%)
Basque: 9 (0.01%)
Cape Verdean: 8 (0.01%)
Belgian: 8 (0.01%)
Polish: 8 (0.01%)
Haitian: 8 (0.01%)
Turkish: 7 (0.01%)
Romanian: 7 (0.01%)
Guyanese: 6 (0.01%)
Scotch-Irish: 5 (0.01%)
Swiss: 5 (0.01%)
Trinidadian and Tobagonian: 4 (0.01%)
Most common places of birth for foreign-born residents (%):
Mexico
Norwalk:
51.7% (16,303)
California:
37.2% (3,881,193)
Philippines
Norwalk:
12.9% (4,057)
California:
7.8% (818,297)
El Salvador
Norwalk:
6.0% (1,893)
California:
4.2% (440,287)
Guatemala
Norwalk:
5.0% (1,573)
California:
2.8% (290,436)
Korea
Norwalk:
3.9% (1,235)
California:
3.0% (315,248)
Vietnam
Norwalk:
1.8% (552)
California:
4.9% (512,335)
Cambodia
Norwalk:
1.7% (543)
California:
0.5% (51,974)
India
Norwalk:
1.5% (488)
California:
5.2% (539,184)
Place of birth for U.S.-born residents:
This state: 55,892
Other state: 3,429
Northeast: 748
Midwest: 1,301
South: 644
West: 736
94.9% of Norwalk residents lived in the same house 1 years ago. Out of people who lived in different houses, 43.4% lived in this county. Out of people who lived in different counties, 73.4% lived in California.
Norwalk:
94.9%
State average:
88.9%
Education attainment for males 25 years and older:
No schooling: 2,199
Nursery to 4th grade: 237
5th and 6th grade: 1,187
7th and 8th grade: 659
9th grade: 731
10th grade: 483
11th grade: 854
12th grade, no diploma: 2,341
High school graduate (or equivalency): 8,636
Less than 1 year of college: 1,875
Some college more than 1 year, no degree: 4,314
Associate degree: 2,346
Bachelor's degree: 5,106
Master's degree: 916
Professional school degree: 332
Doctorate degree: 219
Education attainment for females 25 years and older:
No schooling: 3,136
Nursery to 4th grade: 225
5th and 6th grade: 1,229
7th and 8th grade: 549
9th grade: 229
10th grade: 564
11th grade: 413
12th grade, no diploma: 1,550
High school graduate (or equivalency): 9,576
Less than 1 year of college: 2,518
Some college more than 1 year, no degree: 3,960
Associate degree: 2,645
Bachelor's degree: 5,417
Master's degree: 1,458
Professional school degree: 175
Doctorate degree: 200
Housing units in structures:
One, detached: 21,716
One, attached: 1,268
Two: 200
3 or 4: 743
5 to 9: 1,021
10 to 19: 405
20 to 49: 1,709
50 or more: 845
Mobile homes: 176
Boats, RVs, vans, etc.: 58
Median worth of mobile homes: $84,429
Housing units lacking complete kitchen facilities in 2022: 1.0%
House/condo owner moved in on average 18 years ago