Housing density: 129 houses/condos per square mile
Median price asked for vacant for-sale houses and condos in 2022 in this county: $213,181.
Median contract rent in 2022: $1,215 (lower quartile is $912, upper quartile is $1,810)
Median rent asked for vacant for-rent units in 2022: $1,193
Median gross rent in Marlborough, NY in 2022: $1,546
Housing units in Marlborough with a mortgage: 1,010 (141 second mortgage, 111 home equity loan, 7 both second mortgage and home equity loan) Houses without a mortgage: 620
Compare current foreclosures near Marlborough, NY:
In family households: 136,249 (29,006 male householders, 15,373 female householders)
32,679 spouses, 46,411 children (43,288 natural, 1,072 adopted, 2,051 stepchildren), 2,688 grandchildren, 1,308 brothers or sisters, 1,585 parents, foster children, 1,522 other relatives, 4,657 non-relatives
In nonfamily households: 34,471 (12,699 male householders (9,405 living alone)), 13,971 female householders (11,227 living alone)), 7,801 nonrelatives
In group quarters: 11,773 (4,349 institutionalized population)
27,635 married couples with children.
9,974 single-parent households (2,588 men, 7,386 women).
88.8% of residents of Marlborough speak English at home.
4.1% of residents speak Spanish at home (70% speak English very well, 21% speak English well, 6% speak English not well, 3% don't speak English at all).
5.5% of residents speak other Indo-European language at home (64% speak English very well, 21% speak English well, 14% speak English not well).
0.3% of residents speak Asian or Pacific Island language at home (20% speak English very well, 40% speak English not well, 40% don't speak English at all).
1.3% of residents speak other language at home (60% speak English very well, 24% speak English well, 8% speak English not well, 8% don't speak English at all).
Foreign born population: 815 (9.5%)
(66.3% of them are naturalized citizens)
Year of entry for the foreign-born population in Marlborough, New York
681995 to March 2000
271990 to 1994
621985 to 1989
551980 to 1984
401975 to 1979
411970 to 1974
241965 to 1969
200Before 1965
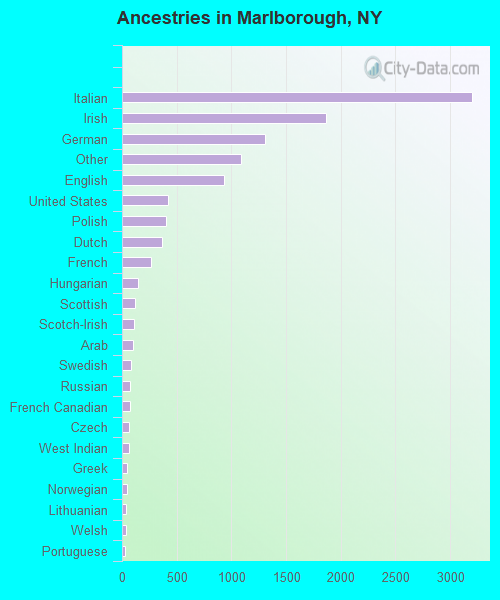
First ancestries reported:
Italian: 3,196 (29.2%)
Irish: 1,867 (17.1%)
German: 1,308 (12.0%)
Other: 1,084 (9.9%)
English: 934 (8.5%)
United States: 421 (3.9%)
Polish: 405 (3.7%)
Dutch: 363 (3.3%)
French: 263 (2.4%)
Hungarian: 143 (1.3%)
Scottish: 123 (1.1%)
Scotch-Irish: 110 (1.0%)
Arab: 99 (0.9%)
Swedish: 79 (0.7%)
Russian: 76 (0.7%)
French Canadian: 70 (0.6%)
Czech: 67 (0.6%)
West Indian: 62 (0.6%)
Greek: 48 (0.4%)
Norwegian: 45 (0.4%)
Lithuanian: 37 (0.3%)
Welsh: 37 (0.3%)
Portuguese: 31 (0.3%)
Ukrainian: 29 (0.3%)
Danish: 14 (0.1%)
Swiss: 12 (0.1%)
Slovak: 6 (0.05%)
Most common places of birth for foreign-born residents (%):
Italy
Marlborough:
28.2% (146)
New York:
3.8% (147,729)
Jamaica
Marlborough:
9.1% (47)
New York:
5.9% (226,470)
Jordan
Marlborough:
7.2% (37)
New York:
0.1% (4,084)
Ecuador
Marlborough:
5.8% (30)
New York:
3.6% (139,226)
Mexico
Marlborough:
3.7% (19)
New York:
4.2% (161,189)
United Kingdom
Marlborough:
3.5% (18)
New York:
1.6% (62,237)
China, excluding Hong Kong and Taiwan
Marlborough:
3.1% (16)
New York:
6.0% (233,766)
Other Western Asia
Marlborough:
3.1% (16)
New York:
0.5% (20,012)
Poland
Marlborough:
2.9% (15)
New York:
2.4% (93,187)
Colombia
Marlborough:
2.9% (15)
New York:
2.9% (111,727)
Romania
Marlborough:
2.5% (13)
New York:
0.6% (25,059)
Ukraine
Marlborough:
2.5% (13)
New York:
2.1% (82,238)
Other Eastern Europe
Marlborough:
2.5% (13)
New York:
1.4% (53,825)
El Salvador
Marlborough:
2.3% (12)
New York:
2.0% (76,977)
Czechoslovakia (includes Czech Republic and Slovakia)
Marlborough:
1.9% (10)
New York:
0.3% (13,246)
Barbados
Marlborough:
1.9% (10)
New York:
0.8% (30,660)
Guatemala
Marlborough:
1.9% (10)
New York:
0.9% (33,208)
Germany
Marlborough:
1.7% (9)
New York:
1.8% (69,327)
Asia, n.e.c.
Marlborough:
1.5% (8)
New York:
0.1% (3,580)
Place of birth for U.S.-born residents:
This state: 6,757
Other state: 1,023
Northeast: 569
Midwest: 105
South: 256
West: 93
66% of Marlborough residents lived in the same house 5 years ago. Out of people who lived in different houses, 52% lived in this county. Out of people who lived in different counties, 84% lived in New York.
Education attainment for males 25 years and older:
No schooling: 19
Nursery to 4th grade: 22
5th and 6th grade: 42
7th and 8th grade: 58
9th grade: 79
10th grade: 144
11th grade: 52
12th grade, no diploma: 121
High school graduate (or equivalency): 748
Less than 1 year of college: 211
Some college more than 1 year, no degree: 359
Associate degree: 305
Bachelor's degree: 322
Master's degree: 115
Professional school degree: 19
Doctorate degree: 33
Education attainment for females 25 years and older:
No schooling: 15
Nursery to 4th grade: 20
5th and 6th grade: 30
7th and 8th grade: 70
9th grade: 39
10th grade: 111
11th grade: 92
12th grade, no diploma: 109
High school graduate (or equivalency): 951
Less than 1 year of college: 207
Some college more than 1 year, no degree: 350
Associate degree: 250
Bachelor's degree: 314
Master's degree: 231
Professional school degree: 41
Doctorate degree: 12
Housing units in structures:
One, detached: 2,217
One, attached: 24
Two: 339
3 or 4: 122
5 to 9: 65
10 to 19: 48
20 to 49: 53
Mobile homes: 315
Boats, RVs, vans, etc.: 8
Median worth of mobile homes: $139,920
Housing units lacking complete plumbing facilities: 1.1%
Housing units lacking complete kitchen facilities: 1.2%