Jump to a detailed profile or search site with Google Custom Search

Kentfield, CA (California) Houses and Residents

Estimated median house or condo value in 2022: $2,270,476 (it was $897,900 in 2000)
Kentfield:

$2,270,476
California:

$715,900
Lower value quartile - upper value quartile: $1,740,537 - Over $2,013,797

Total population: 6,485 (Urban population: 6,377, Rural population: 0)

Houses: 2,915 (2,838 occupied: 2,146 owner occupied, 673 renter occupied)

% of renters here:

24%
State:

44%

Housing density: 973 houses/condos per square mile

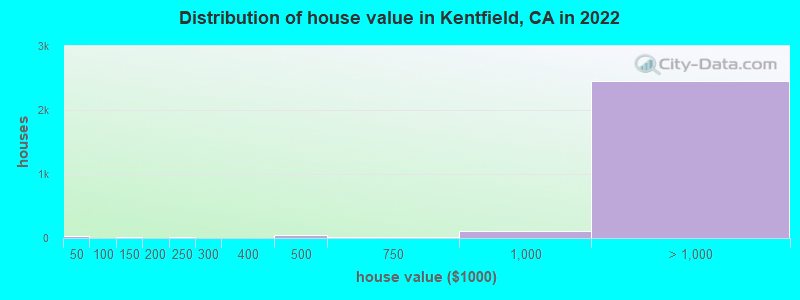
Median price asked for vacant for-sale houses and condos in 2022 in this county: $3,364,178.

Median contract rent in 2022: over $2,000 (lower quartile is $1,946, upper quartile is over $2,000)


Median rent asked for vacant for-rent units in 2022: $2,438


Median gross rent in Kentfield, CA in 2022: over $2,000

Housing units in Kentfield with a mortgage: 1,553 (289 second mortgage, 0 home equity loan, 258 both second mortgage and home equity loan)
Houses without a mortgage: 14

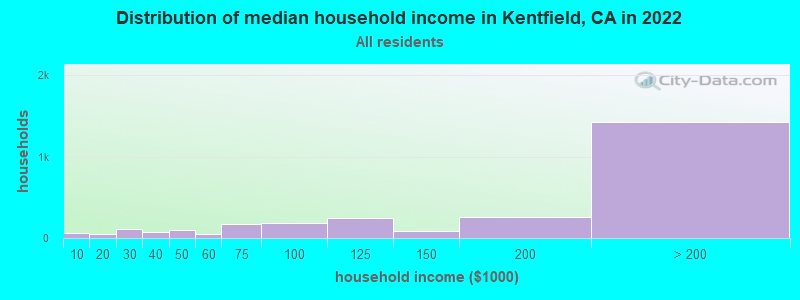
Median household income for houses/condos with a mortgage: $263,303

Median household income for apartments without a mortgage: $126,616

Median monthly housing costs: $3,816

Compare current foreclosures near Kentfield, CA:

Check out more offers near Kentfield, CA.
Powered by Foreclosure.com

Settings
X
Data:
Loading data...
Based on 2000-2022 data
Loading data...

123
Hide US histogram

Latest news about housing in Kentfield, CA collected exclusively by city-data.com from local newspapers, TV, and radio stations

Kentfield, California Age and Sex of Residents
Median year house/condo built: 1955

Median year apartment built: 1959

Household type by relationship:

Households: 7,282
  • Male householders: 1,423 (171 living alone), Female householders: 1,359 (478 living alone)
  • 1,633 spouses (1,595 opposite-sex spouses), 109 unmarried partners, (103 opposite-sex unmarried partners), 2,376 children (2,290 natural, 42 adopted, 44 stepchildren), 26 grandchildren, 44 brothers or sisters, 0 parents, 0 foster children, 42 other relatives, 239 non-relatives
  • In group quarters: 28

Size of family households: 858 2-persons, 371 3-persons, 525 4-persons, 149 5-persons, 64 6-persons.

Size of nonfamily households: 705 1-person, 123 2-persons.

1,555 married couples with children.
224 single-parent households (61 men, 163 women).

83.6% of residents of Kentfield speak English at home.
5.2% of residents speak Spanish at home (85% speak English very well, 5% speak English well, 8% speak English not well, 3% don't speak English at all).
7.1% of residents speak other Indo-European language at home (63% speak English very well, 35% speak English well, 1% speak English not well).
3.8% of residents speak Asian or Pacific Island language at home (71% speak English very well, 24% speak English well, 5% speak English not well).
0.5% of residents speak other language at home (39% speak English very well, 61% speak English not well).

Foreign born population: 899 (12.3%)
(58.5% of them are naturalized citizens)

Median number of rooms in houses and condos:
Here:

7.6
State:

6.0

Median number of rooms in apartments
Here:

4.2
State:

3.9

Owner-occupied Renter-occupied
Bedrooms in owner-occupied houses and condos in Kentfield, California
  • Bedrooms in owner-occupied houses and condos in Kentfield, California
  • 0no bedroom
  • 671 bedroom
  • 1732 bedrooms
  • 7503 bedrooms
  • 7204 bedrooms
  • 4365+ bedrooms
Bedrooms in renter-occupied apartments in Kentfield, California
  • Bedrooms in renter-occupied apartments in Kentfield, California
  • 121no bedroom
  • 1791 bedroom
  • 1282 bedrooms
  • 1913 bedrooms
  • 544 bedrooms
  • 05+ bedrooms
Owner-occupied Renter-occupied
Cars and other vehicles available in Kentfield in owner-occupied houses/condos
  • Cars and other vehicles available in Kentfield in owner-occupied houses/condos
  • 77no vehicle
  • 3871 vehicle
  • 1,0382 vehicles
  • 4753 vehicles
  • 1344 vehicles
  • 355+ vehicles
Cars and other vehicles available in Kentfield in renter-occupied apartments
  • Cars and other vehicles available in Kentfield in renter-occupied apartments
  • 102no vehicle
  • 3451 vehicle
  • 1102 vehicles
  • 933 vehicles
  • 254 vehicles
  • 05+ vehicles
Owner-occupied Renter-occupied
Rooms in owner-occupied houses in Kentfield, California
  • Rooms in owner-occupied houses in Kentfield, California
  • 01 room
  • 02 rooms
  • 553 rooms
  • 594 rooms
  • 1465 rooms
  • 2606 rooms
  • 5147 rooms
  • 5008 rooms
  • 6129+ rooms
Rooms in renter-occupied apartments in Kentfield, California
  • Rooms in renter-occupied apartments in Kentfield, California
  • 1211 room
  • 612 rooms
  • 1173 rooms
  • 424 rooms
  • 1615 rooms
  • 1306 rooms
  • 07 rooms
  • 178 rooms
  • 259+ rooms
Year house built
Median 2022 house/condo value by year built
Median house/condo value by year householder moved into unit
Breakdown of mean house values by ages of householders
  • Kentfield, CA household income distribution

  • Distribution of median household income in Kentfield, CA in 2022
  • 67Less than $10,000
  • 44$10,000 to $19,999
  • 113$20,000 to $29,999
  • 68$30,000 to $39,999
  • 94$40,000 to $49,999
  • 52$50,000 to $59,999
  • 175$60,000 to $74,999
  • 181$75,000 to $99,999
  • 248$100,000 to $124,999
  • 81$125,000 to $149,999
  • 256$150,000 to $199,999
  • 1,424$200,000 or more
  • Home value of owner - occupied houses in 2022 in Kentfield, CA

  • Distribution of house value in Kentfield, CA in 2022
  • 37Less than $10,000
  • 10$100,000 to $124,999
  • 9$200,000 to $249,999
  • 3$300,000 to $399,999
  • 41$400,000 to $499,999
  • 17$500,000 to $749,999
  • 102$750,000 to $999,999
  • 236$1,000,000 to $1,499,999
  • 479$1,500,000 to $1,999,999
  • 1,740$2,000,000 or more
  • Rent paid by renters in 2022 in Kentfield, CA

  • Distribution of rent paid by renters in Kentfield, CA in 2022
  • 7$300 to $349
  • 31$800 to $899
  • 8$1,250 to $1,499
  • 130$1,500 to $1,999
  • 168$2,000 to $2,499
  • 78$2,500 to $2,999
  • 57$3,000 to $3,499
  • 124$3,500 or more
  • 32No cash rent
Time Leaving Home To Go To Work in 2022

Percentage of workers working in this county: 76.8%
Number of people working at home: 1,504 (47.5% of all workers)

Travel time (in minutes) to work in 2022

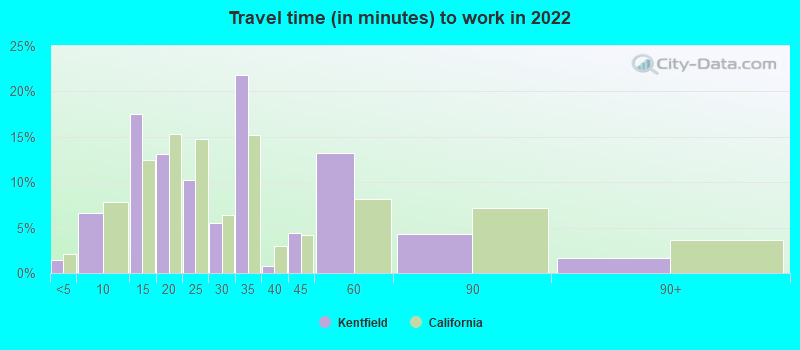
Travel time to work (commute)

  • Less than 5 minutes: 10
  • 5 to 9 minutes: 229
  • 10 to 14 minutes: 340
  • 15 to 19 minutes: 225
  • 20 to 24 minutes: 51
  • 25 to 29 minutes: 73
  • 30 to 34 minutes: 160
  • 35 to 39 minutes: 73
  • 40 to 44 minutes: 132
  • 45 to 59 minutes: 250
  • 60 to 89 minutes: 185
  • 90 or more minutes: 14
Means of transportation to work in 2022 - Kentfield

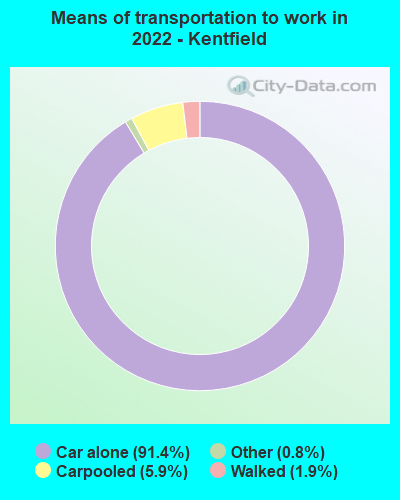
Means of transportation to work:

  • Drove a car alone: 2,228 (56.3%)
  • Carpooled: 138 (3.5%)
  • Taxi: 35 (0.9%)
  • Walked: 58 (1.5%)
  • Worked at home: 1,504 (38.0%)
Class of Workers in 2022
  • Unemployment by race in 2022
  • Unemployment rate for White non-Hispanic residents
  • 4.3%Males
  • 1.9%Females
  • Unemployment rate for two or more race residents
  • 23.1%Females
  • Unemployment rate for Hispanic or Latino residents
  • 35.6%Males
  • 11.6%Females
Year of entry for the foreign-born population in Kentfield, California
  • Year of entry for the foreign-born population in Kentfield, California
  • 3352010 or later
  • 1452000 to 2009
  • 1181990 to 1999
  • 1141980 to 1989
  • 1191970 to 1979
  • 257Before 1970
Ancestries in Kentfield, CA

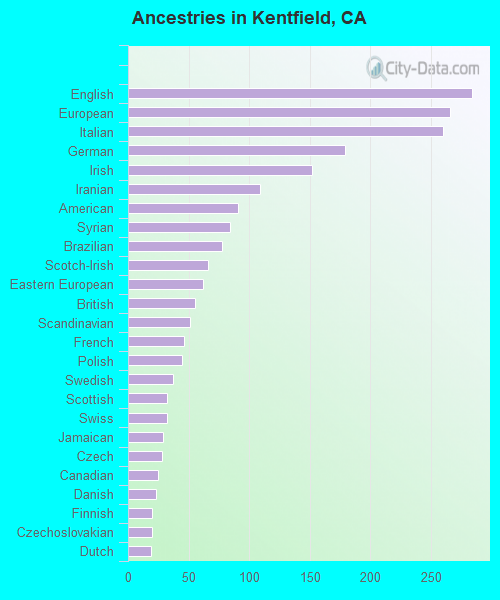
First ancestries reported:

  • English: 284 (9.1%)
  • European: 266 (8.5%)
  • Italian: 260 (8.3%)
  • German: 179 (5.7%)
  • Irish: 152 (4.8%)
  • Iranian: 109 (3.5%)
  • American: 91 (2.9%)
  • Syrian: 84 (2.7%)
  • Brazilian: 78 (2.5%)
  • Scotch-Irish: 66 (2.1%)
  • Eastern European: 62 (2.0%)
  • British: 55 (1.8%)
  • Scandinavian: 51 (1.6%)
  • French: 46 (1.5%)
  • Polish: 45 (1.4%)
  • Swedish: 37 (1.2%)
  • Scottish: 32 (1.0%)
  • Swiss: 32 (1.0%)
  • Jamaican: 29 (0.9%)
  • Czech: 28 (0.9%)
  • Canadian: 25 (0.8%)
  • Danish: 23 (0.7%)
  • Finnish: 20 (0.6%)
  • Czechoslovakian: 20 (0.6%)
  • Dutch: 19 (0.6%)
  • Russian: 16 (0.5%)
  • Austrian: 15 (0.5%)
  • Egyptian: 13 (0.4%)
  • Romanian: 13 (0.4%)
  • Greek: 11 (0.4%)
  • Portuguese: 11 (0.4%)
  • Welsh: 11 (0.4%)
  • Hungarian: 9 (0.3%)
  • Armenian: 8 (0.3%)
  • Lebanese: 7 (0.2%)
  • Palestinian: 6 (0.2%)
  • Northern European: 6 (0.2%)

Most common places of birth for foreign-born residents (%):

Brazil
Kentfield:

10.3% (93)
California:

0.5% (53,222)

Canada
Kentfield:

9.9% (90)
California:

1.2% (127,477)

Sri Lanka
Kentfield:

7.5% (68)
California:

0.1% (11,287)

Taiwan
Kentfield:

7.1% (64)
California:

1.7% (176,274)

Germany
Kentfield:

6.0% (54)
California:

0.7% (73,304)

Italy
Kentfield:

5.0% (45)
California:

0.3% (31,439)

Iran
Kentfield:

4.9% (44)
California:

2.0% (206,004)

Philippines
Kentfield:

4.9% (44)
California:

7.8% (818,297)

Uruguay
Kentfield:

4.3% (39)
California:

0.0% (3,811)

United Kingdom, excluding England and Scotland
Kentfield:

3.3% (30)
California:

0.6% (60,582)

England
Kentfield:

3.2% (29)
California:

0.6% (57,953)

Jamaica
Kentfield:

3.0% (27)
California:

0.2% (15,939)

Syria
Kentfield:

2.9% (26)
California:

0.3% (30,949)

Colombia
Kentfield:

2.5% (23)
California:

0.5% (55,249)

China, excluding Hong Kong and Taiwan
Kentfield:

2.4% (22)
California:

6.6% (684,672)

Denmark
Kentfield:

2.2% (20)
California:

0.1% (6,555)

Korea
Kentfield:

2.2% (20)
California:

3.0% (315,248)

Sweden
Kentfield:

2.0% (18)
California:

0.1% (12,221)

El Salvador
Kentfield:

2.0% (18)
California:

4.2% (440,287)

Place of birth for U.S.-born residents:

  • This state: 3,631
  • Other state: 2,547
  • Northeast: 881
  • Midwest: 873
  • South: 439
  • West: 340

91.6% of Kentfield residents lived in the same house 1 years ago.
   Out of people who lived in different houses, 32.2% lived in this county.
   Out of people who lived in different counties, 45.2% lived in California.


Kentfield:

91.6%
State average:

88.9%

Education attainment for males 25 years and older:

  • No schooling: 0
  • Nursery to 4th grade: 0
  • 5th and 6th grade: 0
  • 7th and 8th grade: 37
  • 9th grade: 0
  • 10th grade: 0
  • 11th grade: 0
  • 12th grade, no diploma: 0
  • High school graduate (or equivalency): 207
  • Less than 1 year of college: 102
  • Some college more than 1 year, no degree: 149
  • Associate degree: 50
  • Bachelor's degree: 922
  • Master's degree: 415
  • Professional school degree: 453
  • Doctorate degree: 106
Educational Attainment for Males

Education attainment for females 25 years and older:

  • No schooling: 4
  • Nursery to 4th grade: 0
  • 5th and 6th grade: 0
  • 7th and 8th grade: 0
  • 9th grade: 0
  • 10th grade: 0
  • 11th grade: 0
  • 12th grade, no diploma: 0
  • High school graduate (or equivalency): 114
  • Less than 1 year of college: 138
  • Some college more than 1 year, no degree: 181
  • Associate degree: 206
  • Bachelor's degree: 1,124
  • Master's degree: 664
  • Professional school degree: 223
  • Doctorate degree: 97
Educational Attainment for Females
Kentfield marital status for males
Kentfield marital status for females

Housing units in structures:

  • One, detached: 2,493
  • One, attached: 58
  • Two: 55
  • 3 or 4: 21
  • 5 to 9: 77
  • 10 to 19: 35
  • 20 to 49: 175
Housing units lacking complete plumbing facilities in 2022: 1.1%

Housing units lacking complete kitchen facilities in 2022: 2.4%

House/condo owner moved in on average 17 years ago

Renter moved in on average 4 years ago

Year householders moved into residence in Kentfield
Houses and condos Apartments
Most commonly used house heating fuel in houses and condos in Kentfield, CA
  • 76.0%Utility gas
  • 20.0%Electricity
  • 2.8%Solar energy
  • 0.6%Bottled, tank, or LP gas
  • 0.6%No fuel used
Most commonly used house heating fuel in apartments in Kentfield, CA
  • 66.6%Utility gas
  • 22.5%Electricity
  • 7.2%No fuel used
  • 3.7%Bottled, tank, or LP gas

Private vs. public school enrollment:

Students in private schools in grades 1 to 8 (elementary and middle school): 232
Here:

26.9%
California:

10.5%

Students in private schools in grades 9 to 12 (high school): 81
Here:

18.5%
California:

8.5%

Students in private undergraduate colleges: 91
Here:

17.6%
California:

15.9%
School Enrollment by Level of School for Male Students
School Enrollment by Level of School for Female Students
Age and Sex of Sensory-Disabled Noninstitutionalized Residents
Age and Sex of Physically-Disabled Noninstitutionalized Residents
Age and Sex of Mentally-Disabled Noninstitutionalized Residents
Age and Sex of Self-Care Disabled Noninstitutionalized Residents
Age and Sex of Go-Outside-Home Disabled Noninstitutionalized Residents
Age and Sex of Noninstitutionalized Residents with Employment Disability