Kalamazoo, MI (Michigan) Houses and Residents
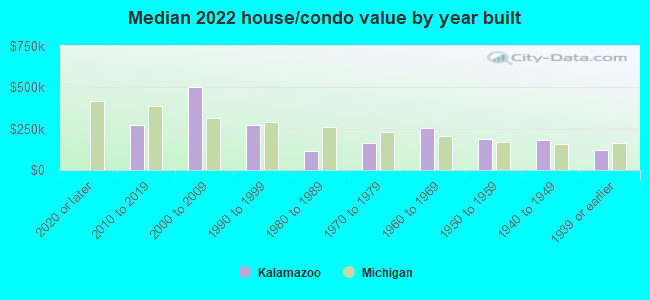
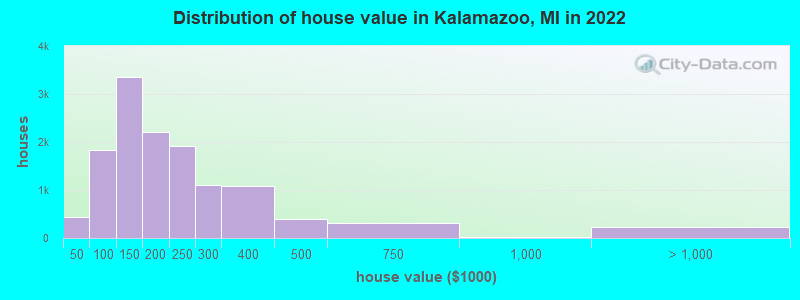
Estimated median house or condo value in 2022: $170,100 (it was $80,700 in 2000 )
Kalamazoo:
$170,100Michigan:
$224,400
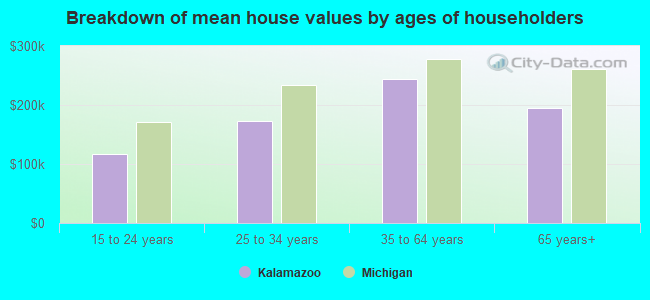
Lower value quartile - upper value quartile: $111,300 - $249,000Mean price in 2022: Detached houses: $206,051 Here:
$206,051State:
$280,038
Townhouses or other attached units: $316,391 Here:
$316,391State:
$239,520
In 2-unit structures: $443,057 Here:
$443,057State:
$219,481
In 3-to-4-unit structures: $178,566 Here:
$178,566State:
$207,067
In 5-or-more-unit structures: $133,349 Here:
$133,349State:
$192,733
Mobile homes: $107,165 Here:
$107,165State:
$72,868
Total population: 75,922 (All urban)
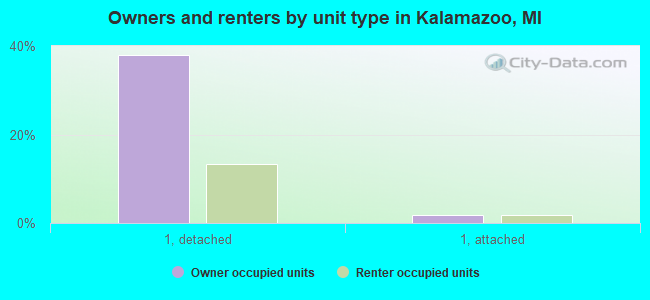
Houses: 32,996 (31,162 occupied: 12,602 owner occupied, 18,560 renter occupied )
% of renters here:
60%State:
27%
Housing density: 1,337 houses/condos per square mile
Median price asked for vacant for-sale houses and condos in 2022: $104,735.
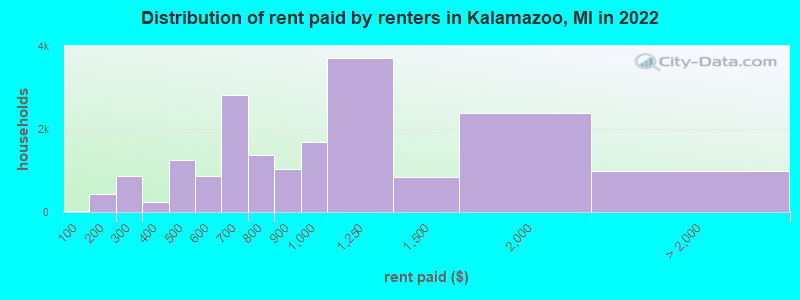
Median contract rent in 2022: $908 (lower quartile is $629, upper quartile is $1,203)
Median rent asked for vacant for-rent units in 2022: $1,154
Median gross rent in Kalamazoo, MI in 2022: $1,058
Housing units in Kalamazoo with a mortgage: 7,585 (777 second mortgage, 0 home equity loan, 647 both second mortgage and home equity loan )Houses without a mortgage: 185
Median household income for houses/condos with a mortgage: $86,715
Median household income for apartments without a mortgage: $56,186
Median monthly housing costs: $1,016
Data:
Median house or condo value ($)
Median house or condo value ($ change since 2000)
Median house or condo value ($) - White
Median house or condo value ($) - Black or African American
Median house or condo value ($) - Asian
Median house or condo value ($) - Hispanic or Latino
Median house or condo value ($) - American Indian and Alaska Native
Median house or condo value ($) - Multirace
Median house or condo value ($) - Other Race
Median price asked for mobile homes ($)
Household density (households per square mile)
Mean house or condo value by units in structure - 1, detached ($)
Mean house or condo value by units in structure - 1, attached ($)
Mean house or condo value by units in structure - 2 ($)
Mean house or condo value by units in structure by units in structure - 3 or 4 ($)
Mean house or condo value by units in structure - 5 or more ($)
Mean house or condo value by units in structure - Boat, RV, van, etc. ($)
Mean house or condo value by units in structure - Mobile home ($)
Median contract rent ($)
Median contract rent - Lower quartile ($)
Median contract rent - Upper quartile ($)
Median gross rent ($)
Urban houses (%)
Rural houses (%)
Houses occupied (%)
Houses occupied (% change since 2000)
Houses owner occupied (%)
Houses owner occupied (% change since 2000)
Houses renter occupied (%)
Houses renter occupied (% change since 2000)
Vacant housing units - For rent (%)
Vacant housing units - For rent (% change since 2000)
Vacant housing units - For sale only (%)
Vacant housing units - For sale only (% change since 2000)
Vacant housing units - Rented or sold, not occupied (%)
Vacant housing units - Rented or sold, not occupied (% change since 2000)
Vacant housing units - For seasonal, recreational, or occasional use (%)
Vacant housing units - For seasonal, recreational, or occasional use (% change since 2000)
Vacant housing units - For migrant workers (%)
Vacant housing units - For migrant workers (% change since 2000)
Vacant housing units - Other vacant (%)
Vacant housing units - Other vacant (% change since 2000)
Median monthly housing costs ($)
Median household income for houses/condos with a mortgage ($)
Median household income for houses/condos without a mortgage ($)
Median household income ($)
Median household income ($) - White
Median household income ($) - Black or African American
Median household income ($) - Asian
Median household income ($) - Hispanic or Latino
Median household income ($) - American Indian and Alaska Native
Median household income ($) - Multirace
Median household income ($) - Other Race
Mortgage status - with mortgage (%)
Mortgage status - with second mortgage (%)
Mortgage status - with home equity loan (%)
Mortgage status - with both second mortgage and home equity loan (%)
Mortgage status - without a mortgage (%)
Median year house/condo built
Median year apartment built
Household type by relationship - Male householder living alone (%)
Household type by relationship - Male householder not living alone (%)
Household type by relationship - Female householder living alone (%)
Household type by relationship - Female householder not living alone (%)
Household type by relationship - Opposite-Sex spouse (%)
Household type by relationship - Same-Sex spouse (%)
Household type by relationship - Opposite-Sex unmarried partner (%)
Household type by relationship - Same-Sex unmarried partner (%)
Household type by relationship - In group quarters (%)
Size of family households - 2-person household (%)
Size of family households - 3-person household (%)
Size of family households - 4-person household (%)
Size of family households - 5-person household (%)
Size of family households - 6-person household (%)
Size of family households - 7-or-more-person household (%)
Size of nonfamily households - 1-person household (%)
Size of nonfamily households - 2-person household (%)
Size of nonfamily households - 3-person household (%)
Size of nonfamily households - 4-person household (%)
Size of nonfamily households - 5-person household (%)
Size of nonfamily households - 6-person household (%)
Size of nonfamily households - 7-or-moreperson household (%)
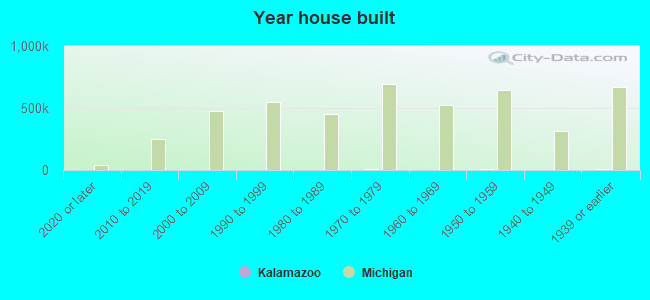
Year house built - Built 2010 or later (%)
Year house built - Built 2000 to 2009 (%)
Year house built - Built 1990 to 1999 (%)
Year house built - Built 1980 to 1989 (%)
Year house built - Built 1970 to 1979 (%)
Year house built - Built 1960 to 1969 (%)
Year house built - Built 1950 to 1959 (%)
Year house built - Built 1940 to 1949 (%)
Year house built - Built 1939 or earlier (%)
Median number of rooms in houses and condos
Median number of rooms in apartments
Median number of bedrooms in owner occupied houses
Mean number of bedrooms in owner occupied houses
Median number of bedrooms in renter occupied houses
Mean number of bedrooms in renter occupied houses
Median number of vehichles in owner occupied houses
Mean number of vehichles in owner occupied houses
Median number of vehichles in renter occupied houses
Mean number of vehichles in renter occupied houses
Rooms in owner-occupied houses - 1 room (%)
Rooms in owner-occupied houses - 2 rooms (%)
Rooms in owner-occupied houses - 3 rooms (%)
Rooms in owner-occupied houses - 4 rooms (%)
Rooms in owner-occupied houses - 5 rooms (%)
Rooms in owner-occupied houses - 6 rooms (%)
Rooms in owner-occupied houses - 7 rooms (%)
Rooms in owner-occupied houses - 8 rooms (%)
Rooms in owner-occupied houses - 9+ rooms (%)
Rooms in renter-occupied houses - 1 room (%)
Rooms in renter-occupied houses - 2 rooms (%)
Rooms in renter-occupied houses - 3 rooms (%)
Rooms in renter-occupied houses - 4 rooms (%)
Rooms in renter-occupied houses - 5 rooms (%)
Rooms in renter-occupied houses - 6 rooms (%)
Rooms in renter-occupied houses - 7 rooms (%)
Rooms in renter-occupied houses - 8 rooms (%)
Rooms in renter-occupied houses - 9+ rooms (%)
Bedrooms in owner-occupied houses - no bedrooms (%)
Bedrooms in owner-occupied houses - 1 bedroom (%)
Bedrooms in owner-occupied houses - 2 bedrooms (%)
Bedrooms in owner-occupied houses - 3 bedrooms (%)
Bedrooms in owner-occupied houses - 4 bedrooms (%)
Bedrooms in owner-occupied houses - 5+ bedrooms (%)
Bedrooms in renter-occupied houses - no bedrooms (%)
Bedrooms in renter-occupied houses - 1 bedroom (%)
Bedrooms in renter-occupied houses - 2 bedrooms (%)
Bedrooms in renter-occupied houses - 3 bedrooms (%)
Bedrooms in renter-occupied houses - 4 bedrooms (%)
Bedrooms in renter-occupied houses - 5+ bedrooms (%)
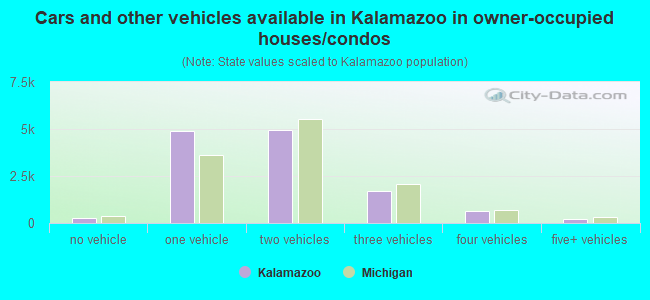
Vehicles available in owner-occupied houses - no vehicle available (%)
Vehicles available in owner-occupied houses - 1 vehicle available(%)
Vehicles available in owner-occupied houses - 2 Vehicles available (%)
Vehicles available in owner-occupied houses - 3 Vehicles available (%)
Vehicles available in owner-occupied houses - 4 Vehicles available (%)
Vehicles available in owner-occupied houses - 5+ Vehicles available (%)
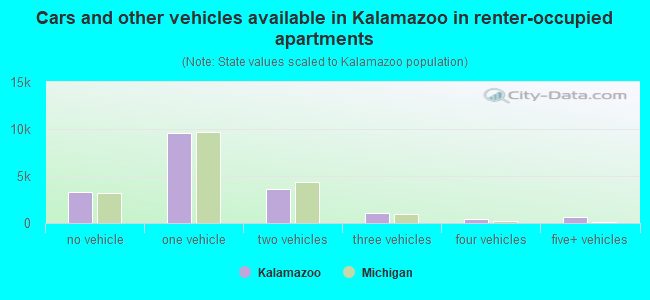
Vehicles available in renter-occupied houses - no vehicle available (%)
Vehicles available in renter-occupied houses - 1 vehicle available (%)
Vehicles available in renter-occupied houses - 2 Vehicles available (%)
Vehicles available in renter-occupied houses - 3 Vehicles available (%)
Vehicles available in renter-occupied houses - 4 Vehicles available (%)
Vehicles available in renter-occupied houses - 5+ Vehicles available (%)
Housing units in structures - 1, detached (%)
Housing units in structures - 1, attached (%)
Housing units in structures - 2 (%)
Housing units in structures - 3 or 4 (%)
Housing units in structures - 5 to 9 (%)
Housing units in structures - 10 to 19 (%)
Housing units in structures - 20 to 49 (%)
Housing units in structures - 50 or more (%)
Housing units in structures - Mobile home (%)
Housing units in structures - Boat, RV, van, etc. (%)
Housing units in structures - Owners - 1, detached (%)
Housing units in structures - Owners - 1, attached (%)
Housing units in structures - Owners - 2 (%)
Housing units in structures - Owners - 3 or 4 (%)
Housing units in structures - Owners - 5 to 9 (%)
Housing units in structures - Owners - 10 to 19 (%)
Housing units in structures - Owners - 20 to 49 (%)
Housing units in structures - Owners - 50 or more (%)
Housing units in structures - Owners - Mobile home (%)
Housing units in structures - Owners - Boat, RV, van, etc. (%)
Housing units in structures - Renters - 1, detached (%)
Housing units in structures - Renters - 1, attached (%)
Housing units in structures - Renters - 2 (%)
Housing units in structures - Renters - 3 or 4 (%)
Housing units in structures - Renters - 5 to 9 (%)
Housing units in structures - Renters - 10 to 19 (%)
Housing units in structures - Renters - 20 to 49 (%)
Housing units in structures - Renters - 50 or more (%)
Housing units in structures - Renters - Mobile home (%)
Housing units in structures - Renters - Boat, RV, van, etc. (%)
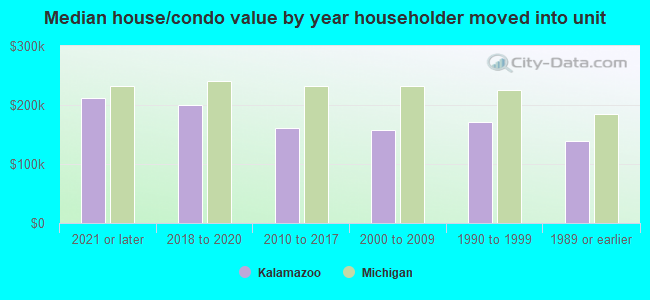
House/condo owner moved in on average (years ago)
Renter moved in on average (years ago)
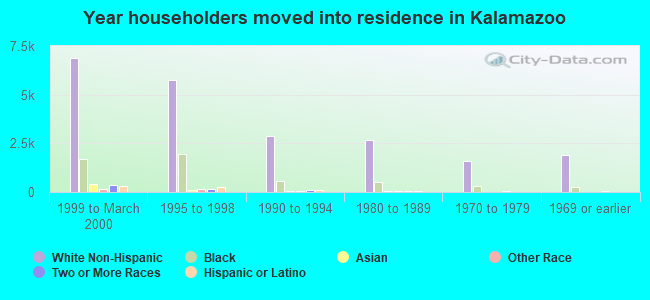
Year householder moved into unit - Moved in 1999 to March 2000 (%)
Year householder moved into unit - Moved in 1999 to March 2000 (%) - White
Year householder moved into unit - Moved in 1999 to March 2000 (%) - Black or African American
Year householder moved into unit - Moved in 1999 to March 2000 (%) - Asian
Year householder moved into unit - Moved in 1999 to March 2000 (%) - Hispanic or Latino
Year householder moved into unit - Moved in 1999 to March 2000 (%) - American Indian and Alaska Native
Year householder moved into unit - Moved in 1999 to March 2000 (%) - Multirace
Year householder moved into unit - Moved in 1999 to March 2000 (%) - Other Race
Year householder moved into unit - Moved in 1995 to 1998 (%)
Year householder moved into unit - Moved in 1995 to 1998 (%) - White
Year householder moved into unit - Moved in 1995 to 1998 (%) - Black or African American
Year householder moved into unit - Moved in 1995 to 1998 (%) - Asian
Year householder moved into unit - Moved in 1995 to 1998 (%) - Hispanic or Latino
Year householder moved into unit - Moved in 1995 to 1998 (%) - American Indian and Alaska Native
Year householder moved into unit - Moved in 1995 to 1998 (%) - Multirace
Year householder moved into unit - Moved in 1995 to 1998 (%) - Other Race
Year householder moved into unit - Moved in 1990 to 1994 (%)
Year householder moved into unit - Moved in 1990 to 1994 (%) - White
Year householder moved into unit - Moved in 1990 to 1994 (%) - Black or African American
Year householder moved into unit - Moved in 1990 to 1994 (%) - Asian
Year householder moved into unit - Moved in 1990 to 1994 (%) - Hispanic or Latino
Year householder moved into unit - Moved in 1990 to 1994 (%) - American Indian and Alaska Native
Year householder moved into unit - Moved in 1990 to 1994 (%) - Multirace
Year householder moved into unit - Moved in 1990 to 1994 (%) - Other Race
Year householder moved into unit - Moved in 1980 to 1989 (%)
Year householder moved into unit - Moved in 1980 to 1989 (%) - White
Year householder moved into unit - Moved in 1980 to 1989 (%) - Black or African American
Year householder moved into unit - Moved in 1980 to 1989 (%) - Asian
Year householder moved into unit - Moved in 1980 to 1989 (%) - Hispanic or Latino
Year householder moved into unit - Moved in 1980 to 1989 (%) - American Indian and Alaska Native
Year householder moved into unit - Moved in 1980 to 1989 (%) - Multirace
Year householder moved into unit - Moved in 1980 to 1989 (%) - Other Race
Year householder moved into unit - Moved in 1970 to 1979 (%)
Year householder moved into unit - Moved in 1970 to 1979 (%) - White
Year householder moved into unit - Moved in 1970 to 1979 (%) - Black or African American
Year householder moved into unit - Moved in 1970 to 1979 (%) - Asian
Year householder moved into unit - Moved in 1970 to 1979 (%) - Hispanic or Latino
Year householder moved into unit - Moved in 1970 to 1979 (%) - American Indian and Alaska Native
Year householder moved into unit - Moved in 1970 to 1979 (%) - Multirace
Year householder moved into unit - Moved in 1970 to 1979 (%) - Other Race
Year householder moved into unit - Moved in 1969 or earlier (%)
Year householder moved into unit - Moved in 1969 or earlier (%) - White
Year householder moved into unit - Moved in 1969 or earlier (%) - Black or African American
Year householder moved into unit - Moved in 1969 or earlier (%) - Asian
Year householder moved into unit - Moved in 1969 or earlier (%) - Hispanic or Latino
Year householder moved into unit - Moved in 1969 or earlier (%) - American Indian and Alaska Native
Year householder moved into unit - Moved in 1969 or earlier (%) - Multirace
Year householder moved into unit - Moved in 1969 or earlier (%) - Other Race
Housing units lacking complete plumbing facilities (%)
Housing units lacking complete kitchen facilities (%)
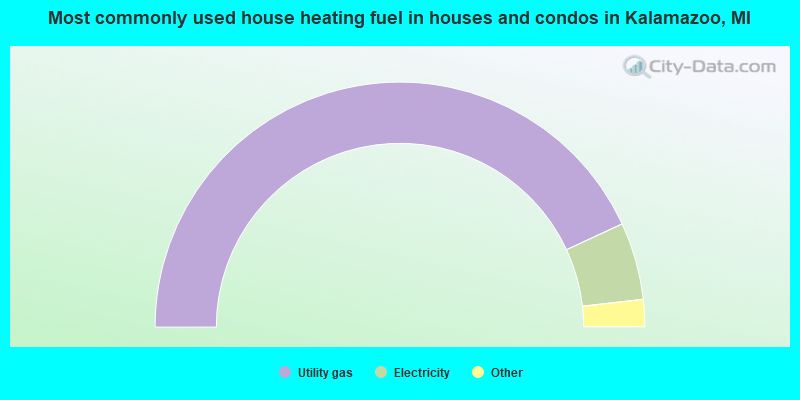
House heating fuel used in houses and condos - Utility gas (%)
House heating fuel used in houses and condos - Bottled, tank, or LP gas (%)
House heating fuel used in houses and condos - Electricity (%)
House heating fuel used in houses and condos - Fuel oil, kerosene, etc. (%)
House heating fuel used in houses and condos - Coal or coke (%)
House heating fuel used in houses and condos - Wood (%)
House heating fuel used in houses and condos - Solar energy (%)
House heating fuel used in houses and condos - Other fuel (%)
House heating fuel used in houses and condos - No fuel used (%)
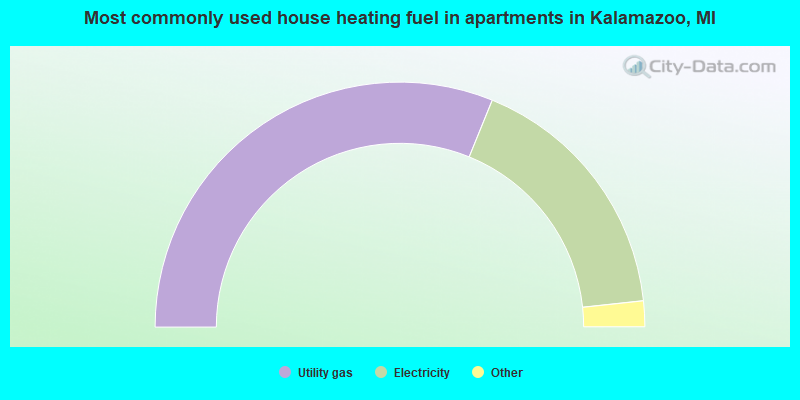
House heating fuel used in apartments - Utility gas (%)
House heating fuel used in apartments - Bottled, tank, or LP gas (%)
House heating fuel used in apartments - Electricity (%)
House heating fuel used in apartments - Fuel oil, kerosene, etc. (%)
House heating fuel used in apartments - Coal or coke (%)
House heating fuel used in apartments - Wood (%)
House heating fuel used in apartments - Solar energy (%)
House heating fuel used in apartments - Other fuel (%)
House heating fuel used in apartments - No fuel used (%)
Latest news about housing in Kalamazoo, MI collected exclusively by city-data.com from local newspapers, TV, and radio stations
Median year house/condo built: 1950Median year apartment built: 1974Household type by relationship:
Households: 72,883
Male householders: 14,507 (6,069 living alone ), Female householders: 16,655 (7,334 living alone )8,045 spouses (7,803 opposite-sex spouses ), 2,903 unmarried partners , (2,189 opposite-sex unmarried partners ), 16,066 children (14,259 natural , 1,159 adopted , 648 stepchildren ), 481 grandchildren , 981 brothers or sisters , 97 parents , 0 foster children , 396 other relatives , 6,757 non-relatives In group quarters: 5,995
Size of family households: 5,066 2-persons , 3,367 3-persons , 1,941 4-persons , 902 5-persons , 316 6-persons , 583 7-or-more-persons .
Size of nonfamily households: 13,403 1-person , 3,779 2-persons , 943 3-persons , 770 4-persons , 92 5-persons .
6,516 married couples with children. single-parent households (1,756 men , 4,171 women ).
89.6% of residents of Kalamazoo speak English at home. of residents speak Spanish at home (78% speak English very well , 13% speak English well , 2% speak English not well , 7% don't speak English at all ).of residents speak other Indo-European language at home (85% speak English very well , 13% speak English well , 2% speak English not well ).of residents speak Asian or Pacific Island language at home (60% speak English very well , 33% speak English well , 6% speak English not well ).of residents speak other language at home (41% speak English very well , 28% speak English well , 24% speak English not well , 7% don't speak English at all ).
Foreign born population: 6,213 (8.5%)of them are naturalized citizens )
Median number of rooms in houses and condos:
Median number of rooms in apartments
Owner-occupied Renter-occupied
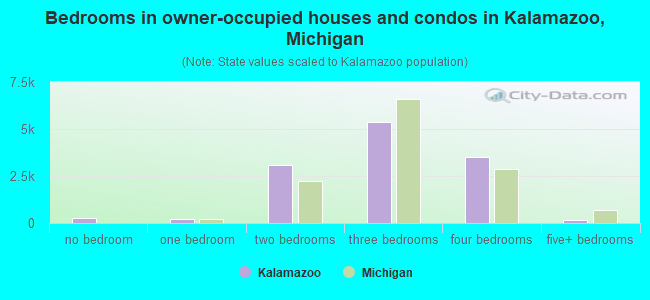
Bedrooms in owner-occupied houses and condos in Kalamazoo, Michigan
282 no bedroom 205 1 bedroom 3,070 2 bedrooms 5,378 3 bedrooms 3,503 4 bedrooms 164 5+ bedrooms
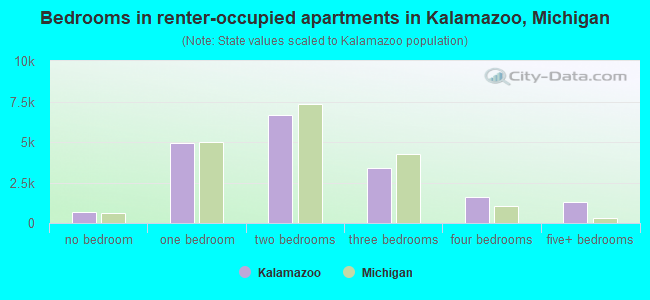
Bedrooms in renter-occupied apartments in Kalamazoo, Michigan
663 no bedroom 4,919 1 bedroom 6,642 2 bedrooms 3,412 3 bedrooms 1,617 4 bedrooms 1,307 5+ bedrooms
Owner-occupied Renter-occupied
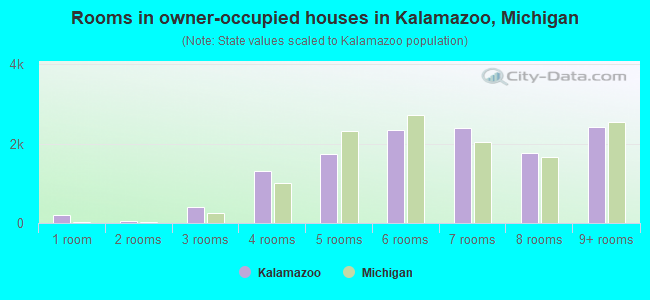
Rooms in owner-occupied houses in Kalamazoo, Michigan
212 1 room 41 2 rooms 399 3 rooms 1,299 4 rooms 1,730 5 rooms 2,351 6 rooms 2,399 7 rooms 1,767 8 rooms 2,404 9+ rooms
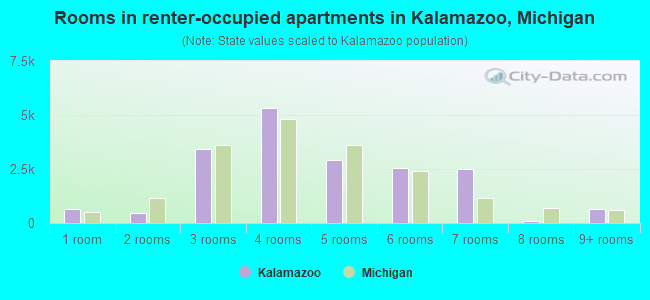
Rooms in renter-occupied apartments in Kalamazoo, Michigan
663 1 room 464 2 rooms 3,431 3 rooms 5,305 4 rooms 2,903 5 rooms 2,552 6 rooms 2,516 7 rooms 75 8 rooms 651 9+ rooms
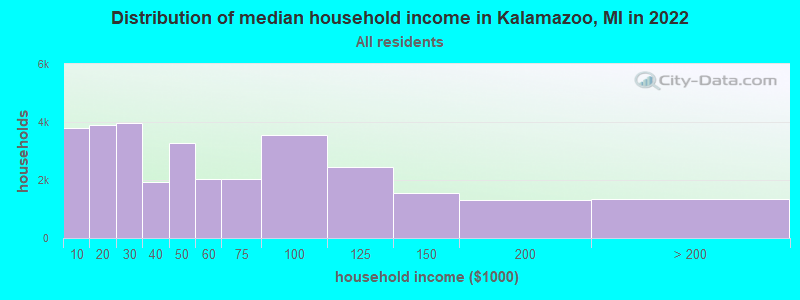
Kalamazoo, MI household income distribution 3,784 Less than $10,0003,912 $10,000 to $19,9993,982 $20,000 to $29,9991,932 $30,000 to $39,9993,278 $40,000 to $49,9992,026 $50,000 to $59,9992,044 $60,000 to $74,9993,556 $75,000 to $99,9992,458 $100,000 to $124,9991,549 $125,000 to $149,9991,311 $150,000 to $199,9991,330 $200,000 or more
Home value of owner - occupied houses in 2022 in Kalamazoo, MI 21 $10,000 to $14,999103 $20,000 to $24,99968 $25,000 to $29,999253 $40,000 to $49,999346 $50,000 to $59,999453 $60,000 to $69,999291 $70,000 to $79,999210 $80,000 to $89,999281 $90,000 to $99,9992,486 $100,000 to $124,999868 $125,000 to $149,9991,147 $150,000 to $174,9991,053 $175,000 to $199,9991,909 $200,000 to $249,9991,099 $250,000 to $299,9991,074 $300,000 to $399,999394 $400,000 to $499,999306 $500,000 to $749,99912 $750,000 to $999,99974 $1,500,000 to $1,999,999154 $2,000,000 or moreRent paid by renters in 2022 in Kalamazoo, MI 35 Less than $100327 $100 to $149106 $150 to $199589 $200 to $249280 $250 to $299194 $300 to $34939 $350 to $399274 $400 to $449983 $450 to $499544 $500 to $549321 $550 to $5991,460 $600 to $6491,362 $650 to $699476 $700 to $749908 $750 to $7991,048 $800 to $8991,687 $900 to $9993,704 $1,000 to $1,249839 $1,250 to $1,4992,390 $1,500 to $1,999166 $2,000 to $2,499184 $2,500 to $2,999262 $3,500 or more382 No cash rent
Percentage of workers working in this county: 91.9%Number of people working at home: 3,053 (8.2% of all workers )
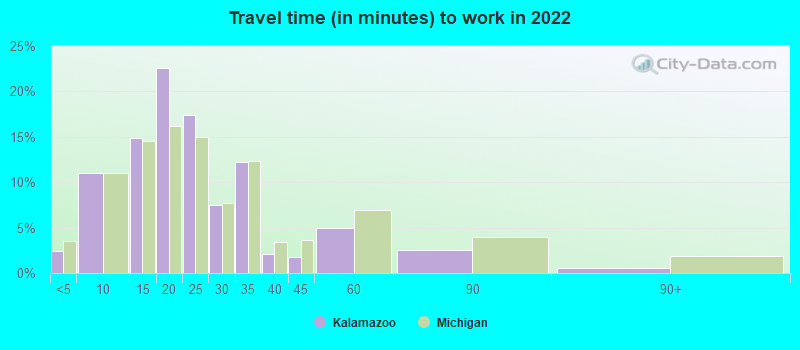
Travel time to work (commute)
Less than 5 minutes: 1,4055 to 9 minutes: 4,96910 to 14 minutes: 6,11815 to 19 minutes: 8,77420 to 24 minutes: 5,16425 to 29 minutes: 1,03230 to 34 minutes: 4,24635 to 39 minutes: 62340 to 44 minutes: 16545 to 59 minutes: 78860 to 89 minutes: 26890 or more minutes: 576
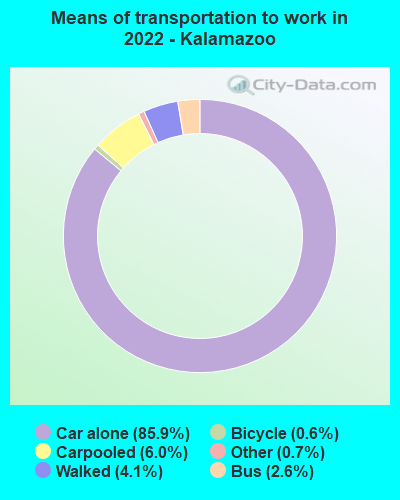
Means of transportation to work:
Drove a car alone: 42,214 (80.1%)Carpooled: 2,976 (5.6%)Bus : 867 (1.6%)Subway or elevated rail : 3 (0.0%)Taxi: 634 (1.2%)Bicycle: 112 (0.2%)Walked: 2,290 (4.3%)Worked at home: 3,053 (5.8%)
Unemployment by race in 2022
Unemployment rate for White non-Hispanic residents 3.4% Males5.0% FemalesUnemployment rate for Black residents 14.6% Males7.6% FemalesUnemployment rate for Asian residents 0.9% Males15.5% FemalesUnemployment rate for other race residents 24.2% Males0.5% FemalesUnemployment rate for two or more race residents 7.6% Males4.0% FemalesUnemployment rate for Hispanic or Latino residents 3.1% Males15.1% Females
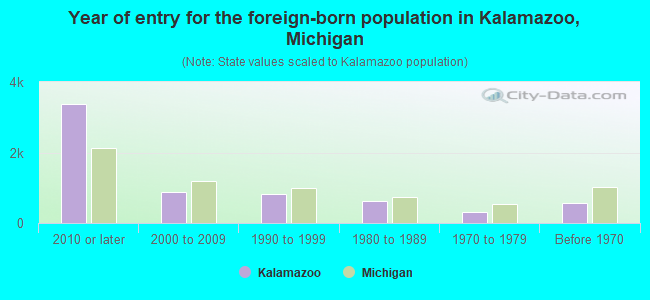
Year of entry for the foreign-born population in Kalamazoo, Michigan
3,380 2010 or later 883 2000 to 2009 814 1990 to 1999 616 1980 to 1989 326 1970 to 1979 573 Before 1970
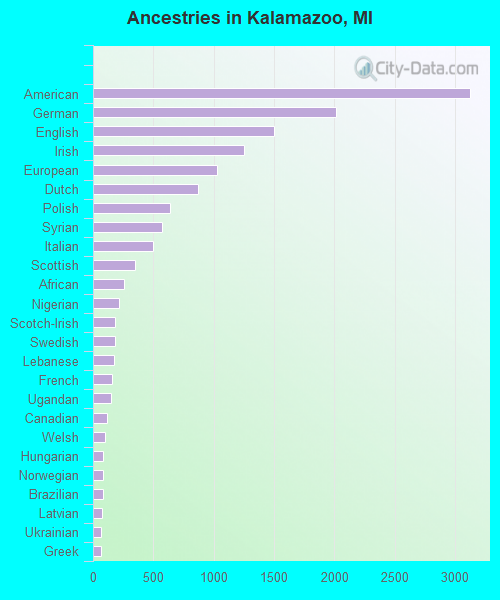
First ancestries reported:
American: 3,127 (10.5%)
German: 2,018 (6.8%)
English: 1,503 (5.1%)
Irish: 1,251 (4.2%)
European: 1,024 (3.5%)
Dutch: 867 (2.9%)
Polish: 641 (2.2%)
Syrian: 571 (1.9%)
Italian: 500 (1.7%)
Scottish: 351 (1.2%)
African: 259 (0.9%)
Nigerian: 212 (0.7%)
Scotch-Irish: 181 (0.6%)
Swedish: 180 (0.6%)
Lebanese: 178 (0.6%)
French: 158 (0.5%)
Ugandan: 149 (0.5%)
Canadian: 117 (0.4%)
Welsh: 97 (0.3%)
Hungarian: 86 (0.3%)
Norwegian: 83 (0.3%)
Brazilian: 82 (0.3%)
Latvian: 75 (0.3%)
Ukrainian: 70 (0.2%)
Greek: 67 (0.2%)
Danish: 63 (0.2%)
Iranian: 62 (0.2%)
Kenyan: 52 (0.2%)
Northern European: 51 (0.2%)
Yugoslavian: 50 (0.2%)
British: 48 (0.2%)
Finnish: 47 (0.2%)
French Canadian: 46 (0.2%)
Scandinavian: 45 (0.2%)
Russian: 43 (0.1%)
Egyptian: 39 (0.1%)
Portuguese: 37 (0.1%)
Austrian: 34 (0.1%)
Cajun: 30 (0.1%)
Czech: 26 (0.09%)
Swiss: 26 (0.09%)
Lithuanian: 25 (0.08%)
Iraqi: 23 (0.08%)
Eastern European: 21 (0.07%)
Croatian: 20 (0.07%)
Somali: 19 (0.06%)
Jamaican: 17 (0.06%)
Belgian: 15 (0.05%)
British West Indian: 15 (0.05%)
Bulgarian: 13 (0.04%)
South African: 13 (0.04%)
Moroccan: 13 (0.04%)
Armenian: 12 (0.04%)
Pennsylvania German: 12 (0.04%)
Arab: 10 (0.03%)
Romanian: 9 (0.03%)
Ethiopian: 5 (0.02%)
Turkish: 5 (0.02%)
Haitian: 5 (0.02%)
Most common places of birth for foreign-born residents (%): Mexico Kalamazoo:
13.5% (740)Michigan:
10.9% (75,965)
Syria Kalamazoo:
10.9% (596)Michigan:
0.9% (5,978)
India Kalamazoo:
8.4% (463)Michigan:
11.1% (77,240)
China, excluding Hong Kong and Taiwan Kalamazoo:
6.6% (362)Michigan:
4.9% (34,295)
Saudi Arabia Kalamazoo:
6.4% (350)Michigan:
0.4% (3,074)
Guatemala Kalamazoo:
3.8% (207)Michigan:
1.0% (7,097)
Philippines Kalamazoo:
3.6% (199)Michigan:
2.8% (19,112)
Democratic Republic of Congo (Zaire) Kalamazoo:
3.4% (188)Michigan:
0.2% (1,416)
Canada Kalamazoo:
3.3% (180)Michigan:
5.0% (35,052)
Netherlands Kalamazoo:
3.1% (168)Michigan:
0.5% (3,681)
Korea Kalamazoo:
2.4% (132)Michigan:
3.0% (20,884)
Uganda Kalamazoo:
2.2% (119)Michigan:
0.1% (835)
Congo Kalamazoo:
2.1% (115)Michigan:
0.1% (963)
Kenya Kalamazoo:
2.0% (112)Michigan:
0.3% (1,965)
Pakistan Kalamazoo:
2.0% (107)Michigan:
1.5% (10,596)
Germany Kalamazoo:
1.6% (88)Michigan:
2.3% (16,126)
Brazil Kalamazoo:
1.5% (84)Michigan:
1.1% (7,485)
Place of birth for U.S.-born residents:
This state: 47,178Other state: 17,232Northeast: 2,063Midwest: 8,085South: 5,560West: 1,524 75.2% of Kalamazoo residents lived in the same house 1 years ago.
Out of people who lived in different houses, 35.7% lived in this county.
Out of people who lived in different counties, 66.2% lived in Michigan.
Kalamazoo:
75.2%State average:
88.4%
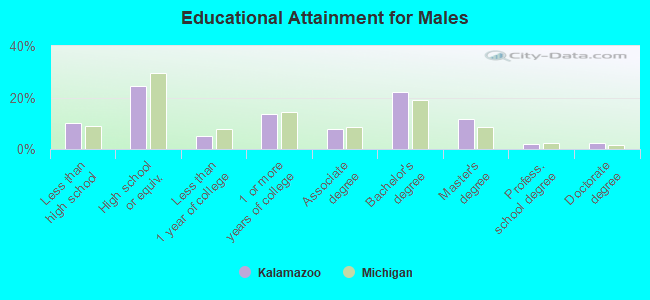
Education attainment for males 25 years and older:
No schooling: 349Nursery to 4th grade: 525th and 6th grade: 347th and 8th grade: 629th grade: 14610th grade: 23811th grade: 70412th grade, no diploma: 226High school graduate (or equivalency): 4,342Less than 1 year of college: 921Some college more than 1 year, no degree: 2,421Associate degree: 1,406Bachelor's degree: 3,955Master's degree: 2,100Professional school degree: 373Doctorate degree: 406
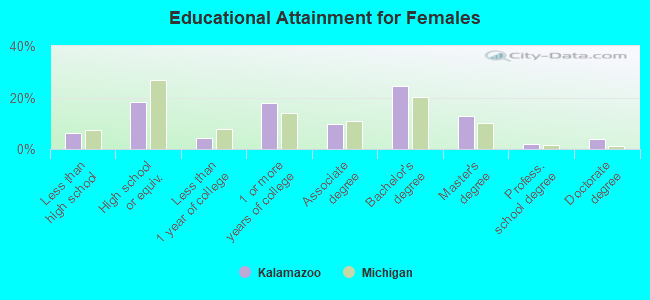
Education attainment for females 25 years and older:
No schooling: 200Nursery to 4th grade: 05th and 6th grade: 647th and 8th grade: 1039th grade: 10710th grade: 36611th grade: 8712th grade, no diploma: 280High school graduate (or equivalency): 3,515Less than 1 year of college: 836Some college more than 1 year, no degree: 3,461Associate degree: 1,887Bachelor's degree: 4,734Master's degree: 2,478Professional school degree: 400Doctorate degree: 778
Housing units in structures:
One, detached: 17,169One, attached: 1,143Two: 1,6743 or 4: 1,8805 to 9: 3,12710 to 19: 2,33020 to 49: 2,38950 or more: 2,570Mobile homes: 714Median worth of mobile homes: $169,244
Housing units lacking complete plumbing facilities in 2022: 0.7%Housing units lacking complete kitchen facilities in 2022: 0.5%House/condo owner moved in on average 10 years ago
Renter moved in on average 0 years ago
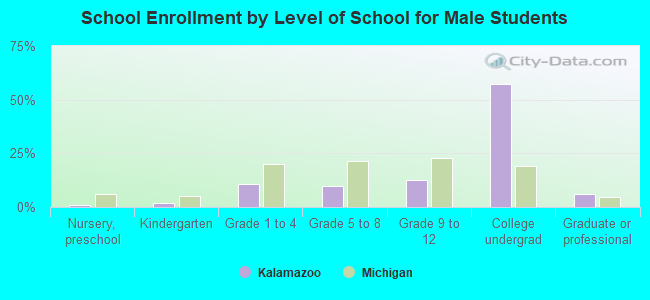
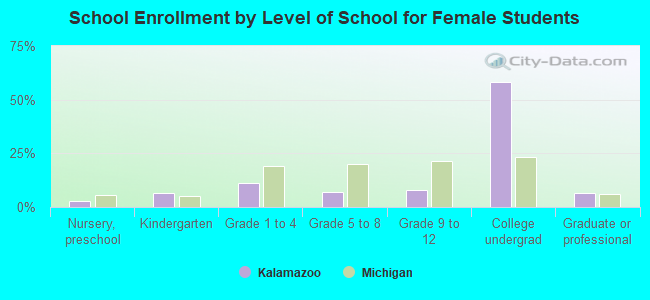
Private vs. public school enrollment:
Students in private schools in grades 1 to 8 (elementary and middle school): 409 Students in private schools in grades 9 to 12 (high school): 347 Students in private undergraduate colleges: 2,190