Johnson City, NY (New York) Houses and Residents
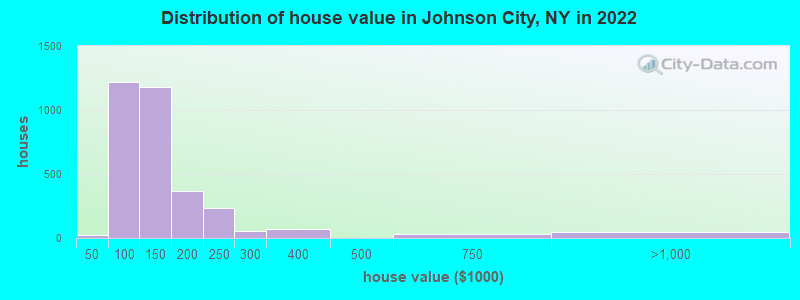
Estimated median house or condo value in 2022: $112,724 (it was $63,700 in 2000 )
Johnson City:
$112,724New York:
$400,400
Lower value quartile - upper value quartile: $93,574 - $153,498Total population: 14,832 (All urban)
Houses: 7,796 (6,734 occupied: 3,505 owner occupied, 3,248 renter occupied )
% of renters here:
48%State:
46%
Housing density: 1,755 houses/condos per square mile
Median price asked for vacant for-sale houses and condos in 2022: $144,056.
Median contract rent in 2022: $785 (lower quartile is $674, upper quartile is $1,002)
Median rent asked for vacant for-rent units in 2022: $569
Median gross rent in Johnson City, NY in 2022: $972
Housing units in Johnson City with a mortgage: 1,844 (121 second mortgage, 0 home equity loan, 111 both second mortgage and home equity loan )Houses without a mortgage: 69
Median household income for houses/condos with a mortgage: $75,447
Median household income for apartments without a mortgage: $66,708
Median monthly housing costs: $977
Data:
Median house or condo value ($)
Median house or condo value ($ change since 2000)
Median house or condo value ($) - White
Median house or condo value ($) - Black or African American
Median house or condo value ($) - Asian
Median house or condo value ($) - Hispanic or Latino
Median house or condo value ($) - American Indian and Alaska Native
Median house or condo value ($) - Multirace
Median house or condo value ($) - Other Race
Median price asked for mobile homes ($)
Household density (households per square mile)
Mean house or condo value by units in structure - 1, detached ($)
Mean house or condo value by units in structure - 1, attached ($)
Mean house or condo value by units in structure - 2 ($)
Mean house or condo value by units in structure by units in structure - 3 or 4 ($)
Mean house or condo value by units in structure - 5 or more ($)
Mean house or condo value by units in structure - Boat, RV, van, etc. ($)
Mean house or condo value by units in structure - Mobile home ($)
Median contract rent ($)
Median contract rent - Lower quartile ($)
Median contract rent - Upper quartile ($)
Median gross rent ($)
Urban houses (%)
Rural houses (%)
Houses occupied (%)
Houses occupied (% change since 2000)
Houses owner occupied (%)
Houses owner occupied (% change since 2000)
Houses renter occupied (%)
Houses renter occupied (% change since 2000)
Vacant housing units - For rent (%)
Vacant housing units - For rent (% change since 2000)
Vacant housing units - For sale only (%)
Vacant housing units - For sale only (% change since 2000)
Vacant housing units - Rented or sold, not occupied (%)
Vacant housing units - Rented or sold, not occupied (% change since 2000)
Vacant housing units - For seasonal, recreational, or occasional use (%)
Vacant housing units - For seasonal, recreational, or occasional use (% change since 2000)
Vacant housing units - For migrant workers (%)
Vacant housing units - For migrant workers (% change since 2000)
Vacant housing units - Other vacant (%)
Vacant housing units - Other vacant (% change since 2000)
Median monthly housing costs ($)
Median household income for houses/condos with a mortgage ($)
Median household income for houses/condos without a mortgage ($)
Median household income ($)
Median household income ($) - White
Median household income ($) - Black or African American
Median household income ($) - Asian
Median household income ($) - Hispanic or Latino
Median household income ($) - American Indian and Alaska Native
Median household income ($) - Multirace
Median household income ($) - Other Race
Mortgage status - with mortgage (%)
Mortgage status - with second mortgage (%)
Mortgage status - with home equity loan (%)
Mortgage status - with both second mortgage and home equity loan (%)
Mortgage status - without a mortgage (%)
Median year house/condo built
Median year apartment built
Household type by relationship - Male householder living alone (%)
Household type by relationship - Male householder not living alone (%)
Household type by relationship - Female householder living alone (%)
Household type by relationship - Female householder not living alone (%)
Household type by relationship - Opposite-Sex spouse (%)
Household type by relationship - Same-Sex spouse (%)
Household type by relationship - Opposite-Sex unmarried partner (%)
Household type by relationship - Same-Sex unmarried partner (%)
Household type by relationship - In group quarters (%)
Size of family households - 2-person household (%)
Size of family households - 3-person household (%)
Size of family households - 4-person household (%)
Size of family households - 5-person household (%)
Size of family households - 6-person household (%)
Size of family households - 7-or-more-person household (%)
Size of nonfamily households - 1-person household (%)
Size of nonfamily households - 2-person household (%)
Size of nonfamily households - 3-person household (%)
Size of nonfamily households - 4-person household (%)
Size of nonfamily households - 5-person household (%)
Size of nonfamily households - 6-person household (%)
Size of nonfamily households - 7-or-moreperson household (%)
Year house built - Built 2010 or later (%)
Year house built - Built 2000 to 2009 (%)
Year house built - Built 1990 to 1999 (%)
Year house built - Built 1980 to 1989 (%)
Year house built - Built 1970 to 1979 (%)
Year house built - Built 1960 to 1969 (%)
Year house built - Built 1950 to 1959 (%)
Year house built - Built 1940 to 1949 (%)
Year house built - Built 1939 or earlier (%)
Median number of rooms in houses and condos
Median number of rooms in apartments
Median number of bedrooms in owner occupied houses
Mean number of bedrooms in owner occupied houses
Median number of bedrooms in renter occupied houses
Mean number of bedrooms in renter occupied houses
Median number of vehichles in owner occupied houses
Mean number of vehichles in owner occupied houses
Median number of vehichles in renter occupied houses
Mean number of vehichles in renter occupied houses
Rooms in owner-occupied houses - 1 room (%)
Rooms in owner-occupied houses - 2 rooms (%)
Rooms in owner-occupied houses - 3 rooms (%)
Rooms in owner-occupied houses - 4 rooms (%)
Rooms in owner-occupied houses - 5 rooms (%)
Rooms in owner-occupied houses - 6 rooms (%)
Rooms in owner-occupied houses - 7 rooms (%)
Rooms in owner-occupied houses - 8 rooms (%)
Rooms in owner-occupied houses - 9+ rooms (%)
Rooms in renter-occupied houses - 1 room (%)
Rooms in renter-occupied houses - 2 rooms (%)
Rooms in renter-occupied houses - 3 rooms (%)
Rooms in renter-occupied houses - 4 rooms (%)
Rooms in renter-occupied houses - 5 rooms (%)
Rooms in renter-occupied houses - 6 rooms (%)
Rooms in renter-occupied houses - 7 rooms (%)
Rooms in renter-occupied houses - 8 rooms (%)
Rooms in renter-occupied houses - 9+ rooms (%)
Bedrooms in owner-occupied houses - no bedrooms (%)
Bedrooms in owner-occupied houses - 1 bedroom (%)
Bedrooms in owner-occupied houses - 2 bedrooms (%)
Bedrooms in owner-occupied houses - 3 bedrooms (%)
Bedrooms in owner-occupied houses - 4 bedrooms (%)
Bedrooms in owner-occupied houses - 5+ bedrooms (%)
Bedrooms in renter-occupied houses - no bedrooms (%)
Bedrooms in renter-occupied houses - 1 bedroom (%)
Bedrooms in renter-occupied houses - 2 bedrooms (%)
Bedrooms in renter-occupied houses - 3 bedrooms (%)
Bedrooms in renter-occupied houses - 4 bedrooms (%)
Bedrooms in renter-occupied houses - 5+ bedrooms (%)
Vehicles available in owner-occupied houses - no vehicle available (%)
Vehicles available in owner-occupied houses - 1 vehicle available(%)
Vehicles available in owner-occupied houses - 2 Vehicles available (%)
Vehicles available in owner-occupied houses - 3 Vehicles available (%)
Vehicles available in owner-occupied houses - 4 Vehicles available (%)
Vehicles available in owner-occupied houses - 5+ Vehicles available (%)
Vehicles available in renter-occupied houses - no vehicle available (%)
Vehicles available in renter-occupied houses - 1 vehicle available (%)
Vehicles available in renter-occupied houses - 2 Vehicles available (%)
Vehicles available in renter-occupied houses - 3 Vehicles available (%)
Vehicles available in renter-occupied houses - 4 Vehicles available (%)
Vehicles available in renter-occupied houses - 5+ Vehicles available (%)
Housing units in structures - 1, detached (%)
Housing units in structures - 1, attached (%)
Housing units in structures - 2 (%)
Housing units in structures - 3 or 4 (%)
Housing units in structures - 5 to 9 (%)
Housing units in structures - 10 to 19 (%)
Housing units in structures - 20 to 49 (%)
Housing units in structures - 50 or more (%)
Housing units in structures - Mobile home (%)
Housing units in structures - Boat, RV, van, etc. (%)
Housing units in structures - Owners - 1, detached (%)
Housing units in structures - Owners - 1, attached (%)
Housing units in structures - Owners - 2 (%)
Housing units in structures - Owners - 3 or 4 (%)
Housing units in structures - Owners - 5 to 9 (%)
Housing units in structures - Owners - 10 to 19 (%)
Housing units in structures - Owners - 20 to 49 (%)
Housing units in structures - Owners - 50 or more (%)
Housing units in structures - Owners - Mobile home (%)
Housing units in structures - Owners - Boat, RV, van, etc. (%)
Housing units in structures - Renters - 1, detached (%)
Housing units in structures - Renters - 1, attached (%)
Housing units in structures - Renters - 2 (%)
Housing units in structures - Renters - 3 or 4 (%)
Housing units in structures - Renters - 5 to 9 (%)
Housing units in structures - Renters - 10 to 19 (%)
Housing units in structures - Renters - 20 to 49 (%)
Housing units in structures - Renters - 50 or more (%)
Housing units in structures - Renters - Mobile home (%)
Housing units in structures - Renters - Boat, RV, van, etc. (%)
House/condo owner moved in on average (years ago)
Renter moved in on average (years ago)
Year householder moved into unit - Moved in 1999 to March 2000 (%)
Year householder moved into unit - Moved in 1999 to March 2000 (%) - White
Year householder moved into unit - Moved in 1999 to March 2000 (%) - Black or African American
Year householder moved into unit - Moved in 1999 to March 2000 (%) - Asian
Year householder moved into unit - Moved in 1999 to March 2000 (%) - Hispanic or Latino
Year householder moved into unit - Moved in 1999 to March 2000 (%) - American Indian and Alaska Native
Year householder moved into unit - Moved in 1999 to March 2000 (%) - Multirace
Year householder moved into unit - Moved in 1999 to March 2000 (%) - Other Race
Year householder moved into unit - Moved in 1995 to 1998 (%)
Year householder moved into unit - Moved in 1995 to 1998 (%) - White
Year householder moved into unit - Moved in 1995 to 1998 (%) - Black or African American
Year householder moved into unit - Moved in 1995 to 1998 (%) - Asian
Year householder moved into unit - Moved in 1995 to 1998 (%) - Hispanic or Latino
Year householder moved into unit - Moved in 1995 to 1998 (%) - American Indian and Alaska Native
Year householder moved into unit - Moved in 1995 to 1998 (%) - Multirace
Year householder moved into unit - Moved in 1995 to 1998 (%) - Other Race
Year householder moved into unit - Moved in 1990 to 1994 (%)
Year householder moved into unit - Moved in 1990 to 1994 (%) - White
Year householder moved into unit - Moved in 1990 to 1994 (%) - Black or African American
Year householder moved into unit - Moved in 1990 to 1994 (%) - Asian
Year householder moved into unit - Moved in 1990 to 1994 (%) - Hispanic or Latino
Year householder moved into unit - Moved in 1990 to 1994 (%) - American Indian and Alaska Native
Year householder moved into unit - Moved in 1990 to 1994 (%) - Multirace
Year householder moved into unit - Moved in 1990 to 1994 (%) - Other Race
Year householder moved into unit - Moved in 1980 to 1989 (%)
Year householder moved into unit - Moved in 1980 to 1989 (%) - White
Year householder moved into unit - Moved in 1980 to 1989 (%) - Black or African American
Year householder moved into unit - Moved in 1980 to 1989 (%) - Asian
Year householder moved into unit - Moved in 1980 to 1989 (%) - Hispanic or Latino
Year householder moved into unit - Moved in 1980 to 1989 (%) - American Indian and Alaska Native
Year householder moved into unit - Moved in 1980 to 1989 (%) - Multirace
Year householder moved into unit - Moved in 1980 to 1989 (%) - Other Race
Year householder moved into unit - Moved in 1970 to 1979 (%)
Year householder moved into unit - Moved in 1970 to 1979 (%) - White
Year householder moved into unit - Moved in 1970 to 1979 (%) - Black or African American
Year householder moved into unit - Moved in 1970 to 1979 (%) - Asian
Year householder moved into unit - Moved in 1970 to 1979 (%) - Hispanic or Latino
Year householder moved into unit - Moved in 1970 to 1979 (%) - American Indian and Alaska Native
Year householder moved into unit - Moved in 1970 to 1979 (%) - Multirace
Year householder moved into unit - Moved in 1970 to 1979 (%) - Other Race
Year householder moved into unit - Moved in 1969 or earlier (%)
Year householder moved into unit - Moved in 1969 or earlier (%) - White
Year householder moved into unit - Moved in 1969 or earlier (%) - Black or African American
Year householder moved into unit - Moved in 1969 or earlier (%) - Asian
Year householder moved into unit - Moved in 1969 or earlier (%) - Hispanic or Latino
Year householder moved into unit - Moved in 1969 or earlier (%) - American Indian and Alaska Native
Year householder moved into unit - Moved in 1969 or earlier (%) - Multirace
Year householder moved into unit - Moved in 1969 or earlier (%) - Other Race
Housing units lacking complete plumbing facilities (%)
Housing units lacking complete kitchen facilities (%)
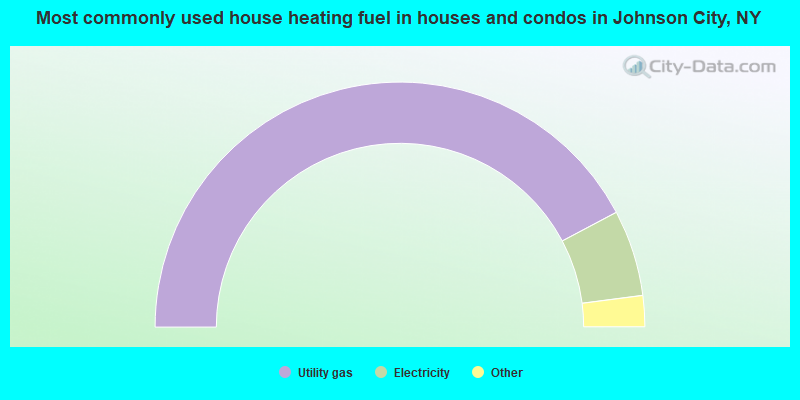
House heating fuel used in houses and condos - Utility gas (%)
House heating fuel used in houses and condos - Bottled, tank, or LP gas (%)
House heating fuel used in houses and condos - Electricity (%)
House heating fuel used in houses and condos - Fuel oil, kerosene, etc. (%)
House heating fuel used in houses and condos - Coal or coke (%)
House heating fuel used in houses and condos - Wood (%)
House heating fuel used in houses and condos - Solar energy (%)
House heating fuel used in houses and condos - Other fuel (%)
House heating fuel used in houses and condos - No fuel used (%)
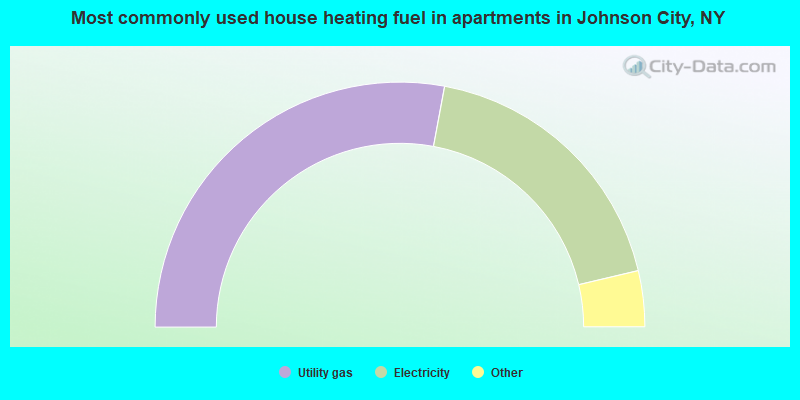
House heating fuel used in apartments - Utility gas (%)
House heating fuel used in apartments - Bottled, tank, or LP gas (%)
House heating fuel used in apartments - Electricity (%)
House heating fuel used in apartments - Fuel oil, kerosene, etc. (%)
House heating fuel used in apartments - Coal or coke (%)
House heating fuel used in apartments - Wood (%)
House heating fuel used in apartments - Solar energy (%)
House heating fuel used in apartments - Other fuel (%)
House heating fuel used in apartments - No fuel used (%)
Median year house/condo built: 1946Median year apartment built: 1961Household type by relationship:
Households: 15,133
Male householders: 2,909 (1,258 living alone ), Female householders: 3,739 (1,390 living alone )2,206 spouses (2,180 opposite-sex spouses ), 740 unmarried partners , (729 opposite-sex unmarried partners ), 3,813 children (3,654 natural , 50 adopted , 108 stepchildren ), 302 grandchildren , 100 brothers or sisters , 189 parents , 0 foster children , 130 other relatives , 522 non-relatives In group quarters: 478
Size of family households: 1,588 2-persons , 896 3-persons , 510 4-persons , 96 5-persons , 172 6-persons , 31 7-or-more-persons .
Size of nonfamily households: 2,621 1-person , 751 2-persons , 64 3-persons , 12 4-persons .
1,087 married couples with children. single-parent households (394 men , 1,176 women ).
83.6% of residents of Johnson City speak English at home. of residents speak Spanish at home (66% speak English very well , 17% speak English well , 13% speak English not well , 4% don't speak English at all ).of residents speak other Indo-European language at home (69% speak English very well , 15% speak English well , 12% speak English not well , 4% don't speak English at all ).of residents speak Asian or Pacific Island language at home (46% speak English very well , 25% speak English well , 24% speak English not well , 4% don't speak English at all ).of residents speak other language at home (62% speak English very well , 21% speak English well , 10% speak English not well , 7% don't speak English at all ).
Foreign born population: 1,498 (9.9%)of them are naturalized citizens )
Median number of rooms in houses and condos:
Median number of rooms in apartments
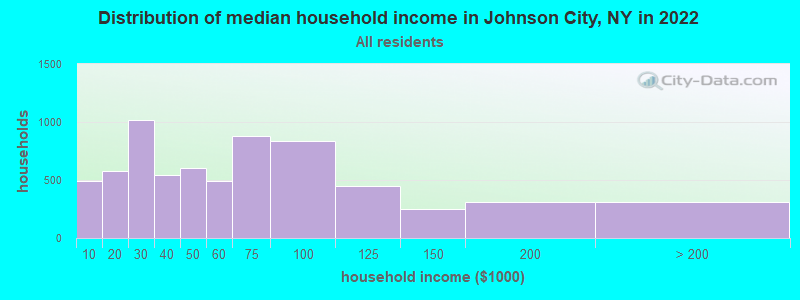
Johnson City, NY household income distribution 493 Less than $10,000575 $10,000 to $19,9991,017 $20,000 to $29,999546 $30,000 to $39,999605 $40,000 to $49,999488 $50,000 to $59,999881 $60,000 to $74,999838 $75,000 to $99,999450 $100,000 to $124,999249 $125,000 to $149,999313 $150,000 to $199,999311 $200,000 or more
Home value of owner - occupied houses in 2022 in Johnson City, NY 8 $10,000 to $14,99918 $40,000 to $49,99956 $50,000 to $59,999208 $60,000 to $69,999243 $70,000 to $79,999323 $80,000 to $89,999368 $90,000 to $99,999758 $100,000 to $124,999420 $125,000 to $149,999236 $150,000 to $174,999131 $175,000 to $199,999231 $200,000 to $249,99956 $250,000 to $299,99971 $300,000 to $399,99930 $500,000 to $749,99941 $750,000 to $999,9993 $1,000,000 to $1,499,999Rent paid by renters in 2022 in Johnson City, NY 7 $150 to $19917 $200 to $24949 $300 to $34944 $350 to $39954 $400 to $44943 $450 to $49980 $500 to $549141 $550 to $599348 $600 to $649387 $650 to $699239 $700 to $749456 $750 to $799334 $800 to $899358 $900 to $999381 $1,000 to $1,249240 $1,250 to $1,499105 $1,500 to $1,99996 $2,000 to $2,49983 No cash rent
Percentage of workers working in this county: 90.9%Number of people working at home: 557 (8.3% of all workers )
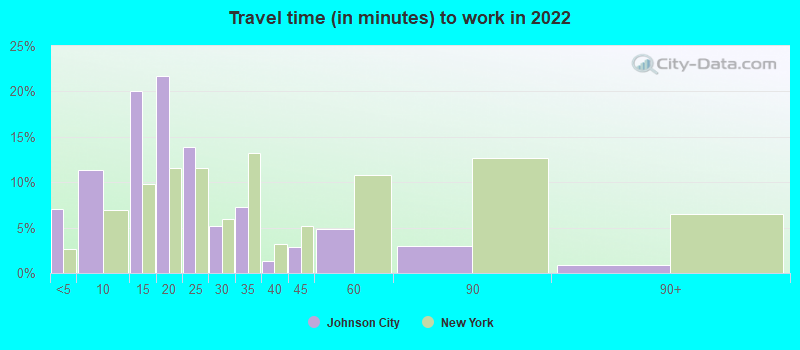
Travel time to work (commute)
Less than 5 minutes: 8185 to 9 minutes: 91710 to 14 minutes: 1,41515 to 19 minutes: 1,43320 to 24 minutes: 55325 to 29 minutes: 13130 to 34 minutes: 27635 to 39 minutes: 4640 to 44 minutes: 10445 to 59 minutes: 15660 to 89 minutes: 11990 or more minutes: 67
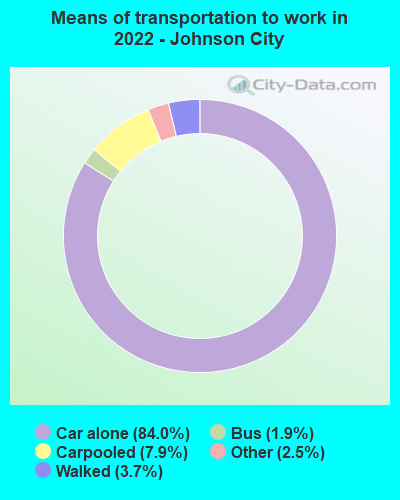
Means of transportation to work:
Drove a car alone: 6,959 (75.8%)Carpooled: 786 (8.6%)Bus : 175 (1.9%)Taxi: 368 (4.0%)Walked: 355 (3.9%)Worked at home: 557 (6.1%)
Unemployment by race in 2022
Unemployment rate for White non-Hispanic residents 5.2% Males8.4% FemalesUnemployment rate for Black residents 17.9% Males22.6% FemalesUnemployment rate for Asian residents 19.1% MalesUnemployment rate for two or more race residents 26.2% Males8.3% Females
Year of entry for the foreign-born population in Johnson City, New York
709 2010 or later 330 2000 to 2009 238 1990 to 1999 196 1980 to 1989 132 1970 to 1979 166 Before 1970
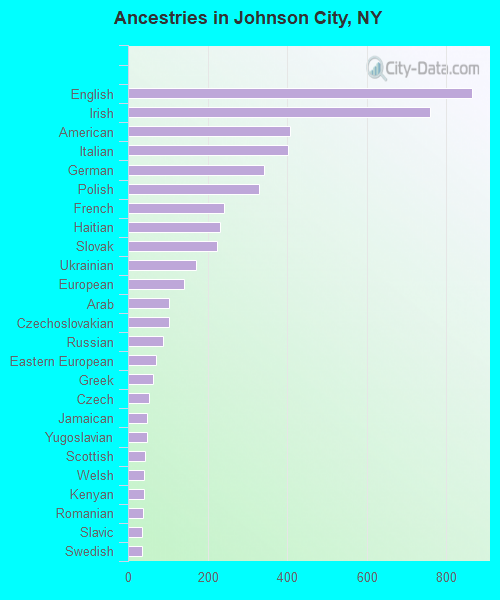
First ancestries reported:
English: 864 (12.4%)
Irish: 759 (10.9%)
American: 407 (5.8%)
Italian: 401 (5.7%)
German: 341 (4.9%)
Polish: 330 (4.7%)
French: 240 (3.4%)
Haitian: 232 (3.3%)
Slovak: 223 (3.2%)
Ukrainian: 171 (2.5%)
European: 141 (2.0%)
Arab: 104 (1.5%)
Czechoslovakian: 102 (1.5%)
Russian: 88 (1.3%)
Eastern European: 70 (1.0%)
Greek: 63 (0.9%)
Czech: 53 (0.8%)
Jamaican: 49 (0.7%)
Yugoslavian: 49 (0.7%)
Scottish: 42 (0.6%)
Welsh: 40 (0.6%)
Kenyan: 39 (0.6%)
Romanian: 38 (0.5%)
Slavic: 36 (0.5%)
Swedish: 36 (0.5%)
African: 31 (0.4%)
Serbian: 29 (0.4%)
French Canadian: 24 (0.3%)
Swiss: 24 (0.3%)
Bulgarian: 18 (0.3%)
Scotch-Irish: 17 (0.2%)
British: 14 (0.2%)
Turkish: 13 (0.2%)
Dutch: 12 (0.2%)
Armenian: 11 (0.2%)
Sudanese: 11 (0.2%)
Iranian: 11 (0.2%)
Norwegian: 8 (0.1%)
Nigerian: 7 (0.1%)
Lebanese: 7 (0.1%)
Albanian: 6 (0.09%) Most common places of birth for foreign-born residents (%): China, excluding Hong Kong and Taiwan Johnson City:
16.7% (264)New York:
9.1% (410,910)
Pakistan Johnson City:
7.8% (123)New York:
1.4% (62,442)
Haiti Johnson City:
5.7% (90)New York:
2.8% (126,936)
Serbia Johnson City:
4.4% (69)New York:
0.1% (5,010)
Laos Johnson City:
4.3% (68)New York:
0.0% (2,177)
Sri Lanka Johnson City:
4.2% (66)New York:
0.2% (7,915)
Kenya Johnson City:
4.1% (65)New York:
0.1% (4,282)
India Johnson City:
4.0% (64)New York:
3.5% (158,432)
Philippines Johnson City:
3.8% (60)New York:
2.0% (91,070)
Bosnia and Herzegovina Johnson City:
3.5% (56)New York:
0.2% (9,472)
Germany Johnson City:
3.2% (51)New York:
0.9% (38,713)
Vietnam Johnson City:
2.7% (43)New York:
0.6% (25,517)
Algeria Johnson City:
2.7% (42)New York:
0.1% (4,189)
Thailand Johnson City:
2.5% (40)New York:
0.3% (14,037)
Greece Johnson City:
2.5% (39)New York:
0.6% (28,604)
Colombia Johnson City:
2.5% (39)New York:
2.5% (111,920)
Canada Johnson City:
1.8% (28)New York:
1.3% (59,107)
Romania Johnson City:
1.8% (28)New York:
0.4% (19,252)
Czechoslovakia (includes Czech Republic and Slovakia) Johnson City:
1.6% (25)New York:
0.2% (8,766)
Jamaica Johnson City:
1.6% (25)New York:
5.0% (227,557)
Place of birth for U.S.-born residents:
This state: 11,085Other state: 2,416Northeast: 1,391Midwest: 202South: 593West: 240 81.9% of Johnson City residents lived in the same house 1 years ago.
Out of people who lived in different houses, 43.1% lived in this county.
Out of people who lived in different counties, 84.6% lived in New York.
Johnson City:
81.9%State average:
89.6%
Education attainment for males 25 years and older:
No schooling: 190Nursery to 4th grade: 575th and 6th grade: 207th and 8th grade: 439th grade: 410th grade: 13711th grade: 6912th grade, no diploma: 214High school graduate (or equivalency): 1,464Less than 1 year of college: 259Some college more than 1 year, no degree: 351Associate degree: 772Bachelor's degree: 876Master's degree: 539Professional school degree: 53Doctorate degree: 78
Education attainment for females 25 years and older:
No schooling: 98Nursery to 4th grade: 115th and 6th grade: 17th and 8th grade: 579th grade: 9210th grade: 6111th grade: 6012th grade, no diploma: 78High school graduate (or equivalency): 1,544Less than 1 year of college: 511Some college more than 1 year, no degree: 471Associate degree: 875Bachelor's degree: 1,057Master's degree: 369Professional school degree: 66Doctorate degree: 54
Housing units in structures:
One, detached: 4,177One, attached: 189Two: 8363 or 4: 7205 to 9: 87010 to 19: 41120 to 49: 20350 or more: 360Mobile homes: 26Housing units lacking complete plumbing facilities in 2022: 5.2%Housing units lacking complete kitchen facilities in 2022: 2.8%House/condo owner moved in on average 17 years ago
Renter moved in on average 2 years ago
Private vs. public school enrollment:
Students in private schools in grades 1 to 8 (elementary and middle school): 82 Students in private schools in grades 9 to 12 (high school): 27 Students in private undergraduate colleges: 192