Huntley, IL (Illinois) Houses and Residents
| Huntley: | $324,060 |
| Illinois: | $251,600 |
Mean price in 2022:
Detached houses: $341,178
Here: $341,178 State: $310,164 Townhouses or other attached units: $221,176
Here: $221,176 State: $286,230 In 3-to-4-unit structures: $173,301
Here: $173,301 State: $330,907 In 5-or-more-unit structures: $253,853
Here: $253,853 State: $318,887
Total population: 25,603 (Urban population: 5,039, Rural population: 639 (all nonfarm))
Houses: 12,576 (12,276 occupied: 11,105 owner occupied, 1,318 renter occupied)
| % of renters here: | 11% |
| State: | 33% |
Housing density: 1,073 houses/condos per square mile
Median price asked for vacant for-sale houses and condos in 2022: $18,020,990.
Median contract rent in 2022: $990
Median gross rent in Huntley, IL in 2022: $1,239
Housing units in Huntley with a mortgage: 5,801 (319 second mortgage, 16 home equity loan, 275 both second mortgage and home equity loan)
Houses without a mortgage: 135
Median household income for houses/condos with a mortgage: $111,160
Median household income for apartments without a mortgage: $56,453
Median monthly housing costs: $1,224
Compare current foreclosures in Huntley, IL:
| Photo | Address | Area | Beds / Baths | Price | Details |
|---|---|---|---|---|---|

|
#1
Nantucket Ln
Huntley, IL 60142
|
3,071 sq. feet
|
3 baths 4 beds |
show details | |

|
#2
Timer Dr
Huntley, IL 60142
|
1,377 sq. feet
|
2 baths 3 beds |
show details | |

|
#3
Golden Gate Ave
Huntley, IL 60142
|
2,625 sq. feet
|
3 baths 3 beds |
show details | |

|
#4
Oregon Trl
Huntley, IL 60142
|
1,900 sq. feet
|
3 baths 3 beds |
show details | |

|
#5
Cape Cod Ln
Huntley, IL 60142
|
2,226 sq. feet
|
4 baths 3 beds |
show details | |

|
#6
Briar Hill Rd
Huntley, IL 60142
|
1,900 sq. feet
|
2 baths 3 beds |
show details | |

|
#7
Chetwood Dr
Huntley, IL 60142
|
2,399 sq. feet
|
2 baths 4 beds |
show details | |

|
#8
Leland Ln
Huntley, IL 60142
|
3,912 sq. feet
|
2 baths 4 beds |
show details | |

|
#9
Evendale Rd
Huntley, IL 60142
|
2,496 sq. feet
|
2 baths 3 beds |
show details | |

|
#10
Hunter Trl
Huntley, IL 60142
|
2,755 sq. feet
|
2 baths 5 beds |
show details |
| Photo | Address | Area | Beds / Baths | Price | Details |
|---|---|---|---|---|---|

|
#11
Oregon Trl
Huntley, IL 60142
|
1,900 sq. feet
|
2 baths 3 beds |
show details | |

|
#12
Rushmore Ln
Huntley, IL 60142
|
1,912 sq. feet
|
2 baths 3 beds |
show details | |

|
#13
Hemlock Rd
Huntley, IL 60142
|
1,604 sq. feet
|
2 baths - beds |
show details | |

|
#14
Evendale Rd
Huntley, IL 60142
|
1,917 sq. feet
|
3 baths 4 beds |
show details | |

|
#15
Ramsdell St
Huntley, IL 60142
|
3,197 sq. feet
|
3 baths 5 beds |
show details | |

|
#16
Milbrook Dr
Huntley, IL 60142
|
2,150 sq. feet
|
- baths 3 beds |
show details | |

|
#17
Wakefield Ln
Huntley, IL 60142
|
1,507 sq. feet
|
2 baths 2 beds |
show details | |

|
#18
Powers Rd
Huntley, IL 60142
|
3,949 sq. feet
|
4 baths - beds |
show details | |

|
#19
Concord Ln
Huntley, IL 60142
|
3,579 sq. feet
|
2 baths 4 beds |
show details | |

|
#20
Sheldon Rd
Huntley, IL 60142
|
3,124 sq. feet
|
- baths - beds |
show details |
| Photo | Address | Area | Beds / Baths | Price | Details |
|---|---|---|---|---|---|

|
#21
Verband Path
Huntley, IL 60142
|
2,653 sq. feet
|
- baths - beds |
show details | |

|
#22
Hawthorne Way
Huntley, IL 60142
|
1,814 sq. feet
|
- baths - beds |
show details | |

|
#23
Margaret Ave
Huntley, IL 60142
|
2,680 sq. feet
|
- baths - beds |
show details | |

|
#24
Hensel Rd
Huntley, IL 60142
|
2,489 sq. feet
|
- baths - beds |
show details | |

|
#25
Shenandoah Dr
Huntley, IL 60142
|
2,287 sq. feet
|
- baths 4 beds |
show details | |

|
#26
Regency Pkwy, Unit 311
Huntley, IL 60142
|
- sq. feet
|
- baths - beds |
show details | |

|
#27
Rainsford Dr
Huntley, IL 60142
|
1,815 sq. feet
|
- baths - beds |
show details | |

|
#28
Coventry Ln
Huntley, IL 60142
|
1,300 sq. feet
|
- baths - beds |
show details | |

|
#29
Butler Ln
Huntley, IL 60142
|
- sq. feet
|
- baths - beds |
show details | |

|
#30
Hillview Dr
Huntley, IL 60142
|
2,247 sq. feet
|
- baths - beds |
show details |
| Photo | Address | Area | Beds / Baths | Price | Details |
|---|---|---|---|---|---|

|
#31
Kelley Ln
Huntley, IL 60142
|
- sq. feet
|
- baths - beds |
show details | |

|
#32
Barko Pkwy
Huntley, IL 60142
|
- sq. feet
|
- baths - beds |
show details | |

|
#33
Bennington Dr
Huntley, IL 60142
|
2,188 sq. feet
|
- baths - beds |
show details | |

|
#34
Cindy Jo Ave Unit A
Huntley, IL 60142
|
- sq. feet
|
- baths - beds |
show details | |

|
#35
Weltzien St
Huntley, IL 60142
|
- sq. feet
|
- baths - beds |
show details | |

|
#36
Longfield Dr
Huntley, IL 60142
|
2,893 sq. feet
|
- baths - beds |
show details | |

|
#37
Douglas Ave Unit B
Huntley, IL 60142
|
- sq. feet
|
- baths - beds |
show details | |

|
#38
Hillsboro Dr
Huntley, IL 60142
|
- sq. feet
|
- baths 4 beds |
show details | |

|
#39
Preston Pkwy
Huntley, IL 60142
|
1,994 sq. feet
|
- baths - beds |
show details | |

|
#40
Blue Bayou Dr
Huntley, IL 60142
|
2,252 sq. feet
|
- baths - beds |
show details |
| Photo | Address | Area | Beds / Baths | Price | Details |
|---|---|---|---|---|---|

|
#41
Bristol Ln
Huntley, IL 60142
|
2,478 sq. feet
|
- baths - beds |
show details | |

|
#42
Crescent Dr
Huntley, IL 60142
|
2,409 sq. feet
|
- baths - beds |
show details | |

|
#43
E Main St Apt 33
Huntley, IL 60142
|
- sq. feet
|
- baths - beds |
show details | |

|
#44
Niagra Ln
Huntley, IL 60142
|
1,833 sq. feet
|
- baths - beds |
show details | |

|
#45
Lancaster St
Huntley, IL 60142
|
1,978 sq. feet
|
- baths - beds |
show details | |

|
#46
Reed Rd
Huntley, IL 60142
|
- sq. feet
|
- baths - beds |
show details | |

|
#47
Harmony Rd
Huntley, IL 60142
|
- sq. feet
|
- baths - beds |
show details | |

|
#48
Hawthorne Way
Huntley, IL 60142
|
- sq. feet
|
- baths - beds |
show details | |

|
#49
Rainsford Dr
Huntley, IL 60142
|
1,815 sq. feet
|
- baths - beds |
show details | |

|
Check over 1 million property listings on Foreclosure.com!
|
browse all offers | |||

Latest news about housing in Huntley, IL collected exclusively by city-data.com from local newspapers, TV, and radio stations

 | Northwest Suburb House Rentals (1 reply) |
| New Construction Homes within 30-45 minutes Elmhurst area (11 replies) |
| Live in Chicagoland, Work in Rockford (26 replies) |
| Newer ranch homes locations (13 replies) |
| Marengo IL and Kennedy homes (0 replies) |
| Does anyone think we're entering another real estate bubble? (220 replies) |

Median year apartment built: 1994
Household type by relationship:
Households: 27,706- Male householders: 5,581 (1,627 living alone), Female householders: 6,569 (2,852 living alone)
6,089 spouses (6,058 opposite-sex spouses), 610 unmarried partners, (597 opposite-sex unmarried partners), 7,958 children (7,449 natural, 132 adopted, 376 stepchildren), 151 grandchildren, 25 brothers or sisters, 399 parents, 30 foster children, 68 other relatives, 213 non-relatives
- In group quarters: 8
Size of family households: 3,371 2-persons, 1,295 3-persons, 1,523 4-persons, 659 5-persons, 103 6-persons, 239 7-or-more-persons.
Size of nonfamily households: 5,153 1-person, 295 2-persons, 26 3-persons.
4,479 married couples with children.
1,102 single-parent households (193 men, 909 women).
89.5% of residents of Huntley speak English at home.
4.4% of residents speak Spanish at home (65% speak English very well, 27% speak English well, 8% speak English not well).
3.6% of residents speak other Indo-European language at home (67% speak English very well, 13% speak English well, 14% speak English not well, 7% don't speak English at all).
2.4% of residents speak Asian or Pacific Island language at home (95% speak English very well, 5% speak English well).
1.2% of residents speak other language at home (93% speak English very well, 6% speak English well, 1% speak English not well).
Foreign born population: 2,991 (10.8%)
(69.3% of them are naturalized citizens)
| Here: | 6.2 |
| State: | 6.4 |
| Here: | 3.9 |
| State: | 4.1 |

- Bedrooms in owner-occupied houses and condos in Huntley, Illinois
- 0no bedroom
- 1791 bedroom
- 5,2242 bedrooms
- 3,1723 bedrooms
- 2,0604 bedrooms
- 4715+ bedrooms

- Bedrooms in renter-occupied apartments in Huntley, Illinois
- 207no bedroom
- 1831 bedroom
- 4922 bedrooms
- 3373 bedrooms
- 844 bedrooms
- 155+ bedrooms

- Cars and other vehicles available in Huntley in owner-occupied houses/condos
- 191no vehicle
- 4,8501 vehicle
- 4,2432 vehicles
- 1,3813 vehicles
- 3284 vehicles
- 1145+ vehicles

- Cars and other vehicles available in Huntley in renter-occupied apartments
- 352no vehicle
- 4901 vehicle
- 2352 vehicles
- 2423 vehicles
- 04 vehicles
- 05+ vehicles

- Rooms in owner-occupied houses in Huntley, Illinois
- 01 room
- 02 rooms
- 4533 rooms
- 1,4874 rooms
- 2,4385 rooms
- 1,8456 rooms
- 1,6687 rooms
- 1,3128 rooms
- 1,9029+ rooms

- Rooms in renter-occupied apartments in Huntley, Illinois
- 2071 room
- 882 rooms
- 783 rooms
- 3954 rooms
- 3315 rooms
- 176 rooms
- 1867 rooms
- 08 rooms
- 159+ rooms


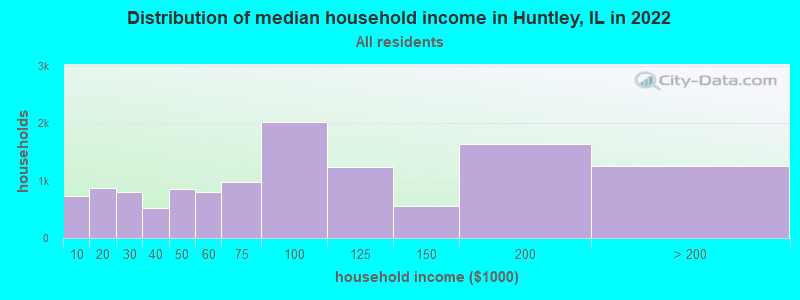
Huntley, IL household income distribution

- 729Less than $10,000
- 866$10,000 to $19,999
- 801$20,000 to $29,999
- 519$30,000 to $39,999
- 858$40,000 to $49,999
- 798$50,000 to $59,999
- 981$60,000 to $74,999
- 2,019$75,000 to $99,999
- 1,229$100,000 to $124,999
- 551$125,000 to $149,999
- 1,633$150,000 to $199,999
- 1,260$200,000 or more
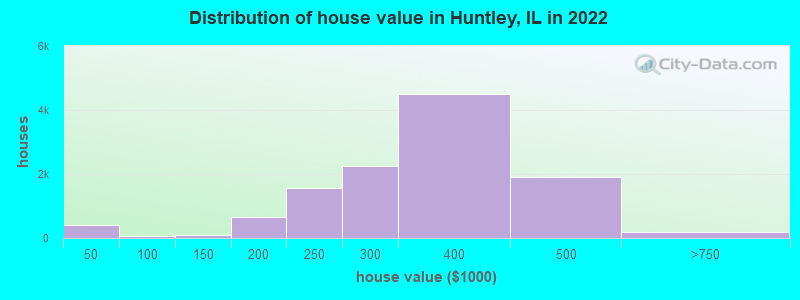
Home value of owner - occupied houses in 2022 in Huntley, IL
-
- 54Less than $10,000
- 218$15,000 to $19,999
- 28$25,000 to $29,999
- 59$30,000 to $34,999
- 39$35,000 to $39,999
- 17$50,000 to $59,999
- 52$80,000 to $89,999
- 64$100,000 to $124,999
- 23$125,000 to $149,999
- 75$150,000 to $174,999
- 567$175,000 to $199,999
- 1,560$200,000 to $249,999
- 2,254$250,000 to $299,999
- 4,486$300,000 to $399,999
- 1,894$400,000 to $499,999
- 193$500,000 to $749,999
Rent paid by renters in 2022 in Huntley, IL
-
- 149Less than $100
- 7$150 to $199
- 25$300 to $349
- 19$400 to $449
- 181$800 to $899
- 76$900 to $999
- 230$1,000 to $1,249
- 44$1,250 to $1,499
- 336$1,500 to $1,999
- 89$2,000 to $2,499
- 46$2,500 to $2,999
- 50No cash rent


Percentage of workers working in this county: 50.9%
Number of people working at home: 2,097 (18.6% of all workers)
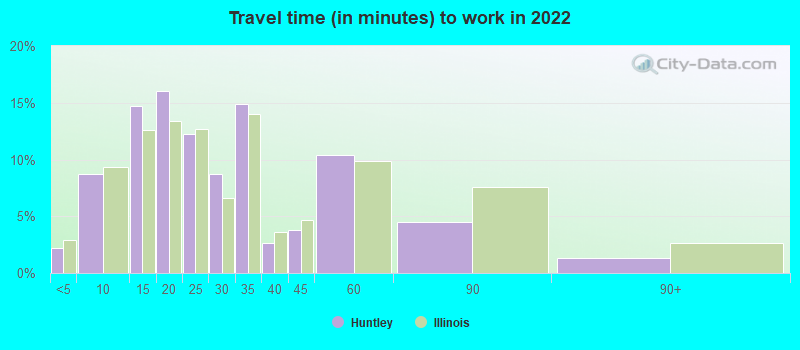
Travel time to work (commute)
- Less than 5 minutes: 155
- 5 to 9 minutes: 600
- 10 to 14 minutes: 1,204
- 15 to 19 minutes: 1,114
- 20 to 24 minutes: 683
- 25 to 29 minutes: 1,160
- 30 to 34 minutes: 1,308
- 35 to 39 minutes: 111
- 40 to 44 minutes: 481
- 45 to 59 minutes: 1,200
- 60 to 89 minutes: 883
- 90 or more minutes: 337
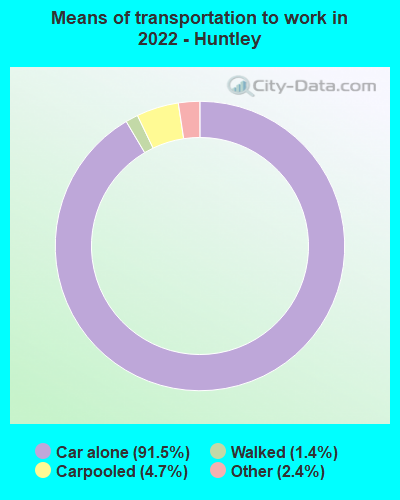
Means of transportation to work:
- Drove a car alone: 7,425 (71.4%)
- Carpooled: 429 (4.1%)
- Taxi: 286 (2.8%)
- Walked: 121 (1.2%)
- Worked at home: 2,097 (20.2%)

- Unemployment by race in 2022
- Unemployment rate for White non-Hispanic residents
- 2.5%Males
- 1.6%Females
- Unemployment rate for Black residents
- 4.0%Males
- 24.9%Females
- Unemployment rate for other race residents
- 12.4%Females
- Unemployment rate for two or more race residents
- 8.3%Males
- 5.9%Females
- Unemployment rate for Hispanic or Latino residents
- 6.5%Males
- 2.3%Females

- Year of entry for the foreign-born population in Huntley, Illinois
- 6322010 or later
- 4152000 to 2009
- 5621990 to 1999
- 491980 to 1989
- 541970 to 1979
- 150Before 1970

First ancestries reported:
- German: 2,073 (16.0%)
- Polish: 1,442 (11.1%)
- Italian: 1,219 (9.4%)
- American: 1,128 (8.7%)
- Irish: 856 (6.6%)
- Nigerian: 361 (2.8%)
- English: 312 (2.4%)
- Scottish: 236 (1.8%)
- Norwegian: 196 (1.5%)
- French Canadian: 184 (1.4%)
- European: 176 (1.4%)
- African: 167 (1.3%)
- Greek: 144 (1.1%)
- British: 141 (1.1%)
- Swedish: 124 (1.0%)
- Eastern European: 100 (0.8%)
- Jamaican: 95 (0.7%)
- Lithuanian: 85 (0.7%)
- Northern European: 75 (0.6%)
- Dutch: 63 (0.5%)
- French: 54 (0.4%)
- Ukrainian: 35 (0.3%)
- Assyrian: 31 (0.2%)
- Czech: 31 (0.2%)
- Arab: 29 (0.2%)
- Welsh: 23 (0.2%)
- Danish: 22 (0.2%)
- Egyptian: 12 (0.09%)
- Albanian: 11 (0.08%)
- Moroccan: 10 (0.08%)
- Russian: 1 (0.01%)
Most common places of birth for foreign-born residents (%):
| Huntley: | 17.3% (480) |
| Illinois: | 5.2% (93,003) |
| Huntley: | 10.2% (284) |
| Illinois: | 34.7% (626,958) |
| Huntley: | 10.1% (282) |
| Illinois: | 6.9% (124,474) |
| Huntley: | 8.3% (230) |
| Illinois: | 1.1% (19,306) |
| Huntley: | 7.3% (203) |
| Illinois: | 2.2% (40,393) |
| Huntley: | 6.6% (183) |
| Illinois: | 9.2% (166,409) |
| Huntley: | 6.3% (175) |
| Illinois: | 1.2% (21,186) |
| Huntley: | 4.9% (137) |
| Illinois: | 0.6% (10,720) |
| Huntley: | 4.7% (131) |
| Illinois: | 1.0% (18,753) |
| Huntley: | 3.2% (88) |
| Illinois: | 0.5% (8,168) |
| Huntley: | 2.4% (68) |
| Illinois: | 1.6% (29,519) |
| Huntley: | 2.2% (61) |
| Illinois: | 0.1% (1,833) |
| Huntley: | 1.9% (53) |
| Illinois: | 0.4% (6,781) |
| Huntley: | 1.5% (43) |
| Illinois: | 1.3% (22,793) |
Place of birth for U.S.-born residents:
- This state: 20,260
- Other state: 4,269
- Northeast: 608
- Midwest: 1,944
- South: 996
- West: 643
91.9% of Huntley residents lived in the same house 1 years ago.
Out of people who lived in different houses, 18.1% lived in this county.
Out of people who lived in different counties, 98.3% lived in Illinois.
| Huntley: | 91.9% |
| State average: | 88.3% |
Education attainment for males 25 years and older:
- No schooling: 17
- Nursery to 4th grade: 18
- 5th and 6th grade: 0
- 7th and 8th grade: 86
- 9th grade: 0
- 10th grade: 64
- 11th grade: 131
- 12th grade, no diploma: 196
- High school graduate (or equivalency): 2,071
- Less than 1 year of college: 546
- Some college more than 1 year, no degree: 1,687
- Associate degree: 774
- Bachelor's degree: 2,514
- Master's degree: 979
- Professional school degree: 182
- Doctorate degree: 429

Education attainment for females 25 years and older:
- No schooling: 103
- Nursery to 4th grade: 31
- 5th and 6th grade: 18
- 7th and 8th grade: 24
- 9th grade: 0
- 10th grade: 131
- 11th grade: 47
- 12th grade, no diploma: 21
- High school graduate (or equivalency): 3,008
- Less than 1 year of college: 1,327
- Some college more than 1 year, no degree: 1,301
- Associate degree: 949
- Bachelor's degree: 2,212
- Master's degree: 1,320
- Professional school degree: 575
- Doctorate degree: 72


Housing units in structures:
- One, detached: 9,291
- One, attached: 2,196
- Two: 32
- 3 or 4: 93
- 5 to 9: 493
- 20 to 49: 215
- 50 or more: 254
House/condo owner moved in on average 8 years ago
Renter moved in on average 5 years ago

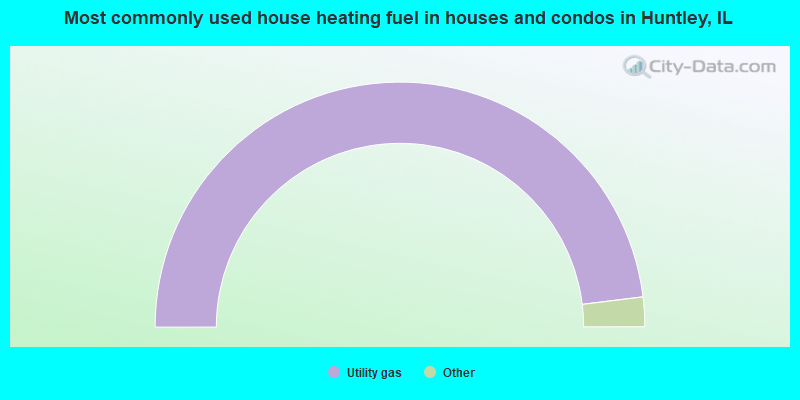
- 96.1%Utility gas
- 2.7%Electricity
- 0.9%Bottled, tank, or LP gas
- 0.2%Solar energy
- 0.1%Wood
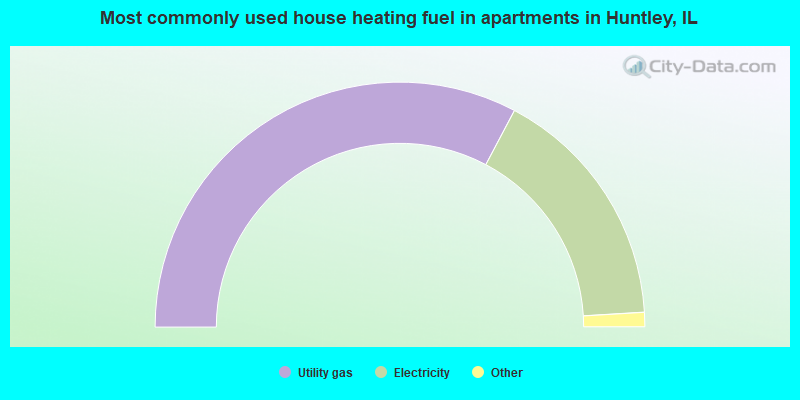
- 65.5%Utility gas
- 32.6%Electricity
- 1.0%No fuel used
- 0.9%Bottled, tank, or LP gas
Private vs. public school enrollment:
| Here: | 5.6% |
| Illinois: | 13.3% |
| Here: | 1.3% |
| Illinois: | 9.9% |
| Here: | 21.1% |
| Illinois: | 27.4% |


