Halawa, HI (Hawaii) Houses and Residents
| Halawa: | $1,018,569 |
| Hawaii: | $820,100 |
Mean price in 2022:
Detached houses: $1,099,712
Here: $1,099,712 State: $1,035,348 Townhouses or other attached units: $1,017,718
Here: $1,017,718 State: $976,474 In 2-unit structures: $1,193,163
Here: $1,193,163 State: $928,739 In 3-to-4-unit structures: $468,617
Here: $468,617 State: $758,960 In 5-or-more-unit structures: $476,201
Here: $476,201 State: $584,974
Total population: 14,014 (Urban population: 13,937, Rural population: 18 (all nonfarm))
Houses: 5,006 (4,777 occupied: 3,236 owner occupied, 1,555 renter occupied)
| % of renters here: | 32% |
| State: | 37% |
Housing density: 2,153 houses/condos per square mile
Median price asked for vacant for-sale houses and condos in 2022 in this county: $1,374,313.
Median contract rent in 2022: $1,367 (lower quartile is $841, upper quartile is over $2,000)
Median rent asked for vacant for-rent units in 2022: $2,346
Median gross rent in Halawa, HI in 2022: $1,480
Housing units in Halawa with a mortgage: 1,942 (497 second mortgage, 10 home equity loan, 472 both second mortgage and home equity loan)
Houses without a mortgage: 83
Median household income for houses/condos with a mortgage: $143,247
Median household income for apartments without a mortgage: $102,351
Median monthly housing costs: $1,560
Compare current foreclosures near Halawa, HI:
| Photo | Address | Area | Beds / Baths | Price | Details |
|---|---|---|---|---|---|

|
#1
Alexander St Apt 503
Honolulu, HI 96826
|
625 sq. feet
|
1 baths 1 beds |
$249,900
|
show details |

|
#2
Richard Ln Apt B613
Honolulu, HI 96819
|
643 sq. feet
|
1 baths 2 beds |
$355,000
|
show details |

|
#3
Palolo Avenue
Honolulu, HI 96816
|
1,162 sq. feet
|
1 baths 3 beds |
$774,900
|
show details |

|
#4
-133 Pupupuhi St Unit
Waipahu, HI 96797
|
1,176 sq. feet
|
3 baths 3 beds |
$499,900
|
show details |

|
#5
Ala Wai Blvd Apt 507
Honolulu, HI 96815
|
674 sq. feet
|
1 baths 2 beds |
$319,900
|
show details |

|
#6
Paihi St
Aiea, HI 96701
|
1,000 sq. feet
|
2 baths 3 beds |
show details | |

|
#7
Walea St
Wahiawa, HI 96786
|
2,540 sq. feet
|
5 baths 5 beds |
show details | |

|
#8
Maunawili Cir
Kailua, HI 96734
|
5,066 sq. feet
|
4 baths 7 beds |
show details | |

|
#9
California Ave Apt 18h
Wahiawa, HI 96786
|
812 sq. feet
|
1 baths 2 beds |
show details | |

|
#10
Keawe St # 206
Honolulu, HI 96813
|
1,063 sq. feet
|
2 baths 2 beds |
show details |
| Photo | Address | Area | Beds / Baths | Price | Details |
|---|---|---|---|---|---|

|
#11
-1104 Heahea St
Waipahu, HI 96797
|
- sq. feet
|
2 baths 3 beds |
show details | |

|
#12
Kaieleele St
Ewa Beach, HI 96706
|
1,683 sq. feet
|
2 baths 3 beds |
show details | |

|
#13
Kanela St # T-87
Ewa Beach, HI 96706
|
1,649 sq. feet
|
3 baths 4 beds |
show details | |

|
#14
Kiokio Pl
Waipahu, HI 96797
|
2,733 sq. feet
|
5 baths 6 beds |
show details | |

|
#15
Laulauna St # 46l
Ewa Beach, HI 96706
|
879 sq. feet
|
2 baths 3 beds |
show details | |

|
#16
Makalea St # 134
Ewa Beach, HI 96706
|
1,317 sq. feet
|
3 baths 3 beds |
show details | |

|
#17
Panana St Apt 62
Kapolei, HI 96707
|
1,335 sq. feet
|
2 baths 4 beds |
show details | |

|
#18
Welo St Apt 106
Kapolei, HI 96707
|
1,335 sq. feet
|
2 baths 4 beds |
show details | |

|
#19
Karsten Dr Apt A
Wahiawa, HI 96786
|
976 sq. feet
|
1 baths 3 beds |
show details | |

|
#20
Kupuohi St Apt 16-101
Waipahu, HI 96797
|
759 sq. feet
|
2 baths 2 beds |
show details |
| Photo | Address | Area | Beds / Baths | Price | Details |
|---|---|---|---|---|---|

|
#21
Prospect St Apt 512
Honolulu, HI 96822
|
600 sq. feet
|
1 baths 1 beds |
show details | |

|
#22
Makalea St # 58
Ewa Beach, HI 96706
|
1,364 sq. feet
|
3 baths 3 beds |
show details | |

|
#23
Kapiolani Blvd # 1202
Honolulu, HI 96813
|
922 sq. feet
|
2 baths 2 beds |
show details | |

|
#24
Pualani Way Apt 704
Honolulu, HI 96815
|
625 sq. feet
|
1 baths 1 beds |
show details | |

|
#25
-140 Kupuohi Pl
Waipahu, HI 96797
|
1,128 sq. feet
|
2 baths 3 beds |
show details | |

|
#26
Ala Wai Blvd Apt 1007
Honolulu, HI 96815
|
598 sq. feet
|
1 baths 1 beds |
show details | |

|
#27
Alawiki St
Kaneohe, HI 96744
|
1,152 sq. feet
|
2 baths 3 beds |
show details | |

|
#28
Ahinahina Pl
Honolulu, HI 96816
|
3,874 sq. feet
|
4 baths 3 beds |
show details | |

|
#29
Kuilioloa Pl Apt T2
Ewa Beach, HI 96706
|
1,052 sq. feet
|
1 baths 3 beds |
show details | |

|
#30
Wailohia Pl
Ewa Beach, HI 96706
|
1,143 sq. feet
|
2 baths 3 beds |
show details |
| Photo | Address | Area | Beds / Baths | Price | Details |
|---|---|---|---|---|---|

|
#31
Aaliamanu Pl
Honolulu, HI 96813
|
3,188 sq. feet
|
2 baths 7 beds |
show details | |

|
#32
Pensacola St Apt 808
Honolulu, HI 96822
|
630 sq. feet
|
1 baths 2 beds |
show details | |

|
#33
Pensacola St # 106
Honolulu, HI 96814
|
745 sq. feet
|
2 baths 2 beds |
show details | |

|
#34
Kaimalie St Apt P3
Ewa Beach, HI 96706
|
1,008 sq. feet
|
3 baths 2 beds |
show details | |

|
#35
Queen St # 1011
Honolulu, HI 96814
|
468 sq. feet
|
1 baths 1 beds |
show details | |

|
#36
Makalea St # 146
Ewa Beach, HI 96706
|
1,259 sq. feet
|
3 baths 3 beds |
show details | |

|
#37
Pauoa Rd
Honolulu, HI 96813
|
1,162 sq. feet
|
1 baths 2 beds |
show details | |

|
#38
Kuanoo St
Ewa Beach, HI 96706
|
2,103 sq. feet
|
3 baths 4 beds |
show details | |

|
#39
Lumiauau St # F1
Waipahu, HI 96797
|
1,446 sq. feet
|
3 baths 3 beds |
show details | |

|
#40
Kailua Rd
Kailua, HI 96734
|
2,836 sq. feet
|
4 baths 4 beds |
show details |
| Photo | Address | Area | Beds / Baths | Price | Details |
|---|---|---|---|---|---|

|
#41
Akamai St
Kailua, HI 96734
|
2,062 sq. feet
|
3 baths 4 beds |
show details | |

|
#42
Lumiauau St
Waipahu, HI 96797
|
1,084 sq. feet
|
2 baths 3 beds |
show details | |

|
#43
Kokea St Apt C101
Honolulu, HI 96817
|
879 sq. feet
|
2 baths 4 beds |
show details | |

|
#44
Akoakoa St
Kailua, HI 96734
|
1,926 sq. feet
|
3 baths 2 beds |
show details | |

|
#45
Aoloa St Apt Q203
Kailua, HI 96734
|
814 sq. feet
|
2 baths 2 beds |
show details | |

|
#46
Akuila Pl
Kailua, HI 96734
|
1,818 sq. feet
|
3 baths 4 beds |
show details | |

|
#47
Black Point Rd
Honolulu, HI 96816
|
1,570 sq. feet
|
2 baths 5 beds |
show details | |

|
#48
Iki Pl Apt A
Honolulu, HI 96821
|
966 sq. feet
|
2 baths 3 beds |
show details | |

|
#49
Lumi St
Waipahu, HI 96797
|
3,208 sq. feet
|
4 baths 5 beds |
show details | |

|
Check over 1 million property listings on Foreclosure.com!
|
browse all offers | |||

Latest news about housing in Halawa, HI collected exclusively by city-data.com from local newspapers, TV, and radio stations

 | Moving to Oahu, want the real deal (55 replies) |
| Where to live if working at Fort Shafter? (3 replies) |
| Street Gangs (51 replies) |
| Relocation Questions (40 replies) |
| Moving to Maui with children? (41 replies) |
| Wahiawa area - safe or not. (22 replies) |

Median year apartment built: 1975
Household type by relationship:
Households: 14,204- Male householders: 2,289 (473 living alone), Female householders: 2,367 (661 living alone)
2,218 spouses (2,209 opposite-sex spouses), 247 unmarried partners, (233 opposite-sex unmarried partners), 3,808 children (3,727 natural, 54 adopted, 26 stepchildren), 937 grandchildren, 126 brothers or sisters, 405 parents, 0 foster children, 547 other relatives, 928 non-relatives
- In group quarters: 328
Size of family households: 1,266 2-persons, 706 3-persons, 502 4-persons, 330 5-persons, 174 6-persons, 258 7-or-more-persons.
Size of nonfamily households: 1,201 1-person, 225 2-persons, 22 3-persons, 37 4-persons, 33 5-persons, 29 6-persons.
948 married couples with children.
440 single-parent households (66 men, 374 women).
69.7% of residents of Halawa speak English at home.
0.5% of residents speak Spanish at home (61% speak English very well, 29% speak English well, 10% speak English not well).
1.1% of residents speak other Indo-European language at home (62% speak English very well, 38% speak English well).
27.8% of residents speak Asian or Pacific Island language at home (40% speak English very well, 43% speak English well, 13% speak English not well, 3% don't speak English at all).
0.2% of residents speak other language at home (77% speak English very well, 23% speak English well).
Foreign born population: 3,060 (21.5%)
(67.8% of them are naturalized citizens)
| Here: | 6.5 |
| State: | 5.5 |
| Here: | 4.2 |
| State: | 3.9 |

- Bedrooms in owner-occupied houses and condos in Halawa, Hawaii
- 12no bedroom
- 1201 bedroom
- 4862 bedrooms
- 1,1143 bedrooms
- 8544 bedrooms
- 6515+ bedrooms

- Bedrooms in renter-occupied apartments in Halawa, Hawaii
- 112no bedroom
- 1971 bedroom
- 5932 bedrooms
- 5163 bedrooms
- 1154 bedrooms
- 235+ bedrooms

- Cars and other vehicles available in Halawa in owner-occupied houses/condos
- 131no vehicle
- 1,0011 vehicle
- 1,0462 vehicles
- 4423 vehicles
- 3154 vehicles
- 3015+ vehicles

- Cars and other vehicles available in Halawa in renter-occupied apartments
- 230no vehicle
- 7801 vehicle
- 4132 vehicles
- 713 vehicles
- 514 vehicles
- 115+ vehicles

- Rooms in owner-occupied houses in Halawa, Hawaii
- 121 room
- 332 rooms
- 2803 rooms
- 3144 rooms
- 5545 rooms
- 4836 rooms
- 4597 rooms
- 4748 rooms
- 6279+ rooms

- Rooms in renter-occupied apartments in Halawa, Hawaii
- 1121 room
- 802 rooms
- 2093 rooms
- 5144 rooms
- 3835 rooms
- 1726 rooms
- 297 rooms
- 418 rooms
- 159+ rooms


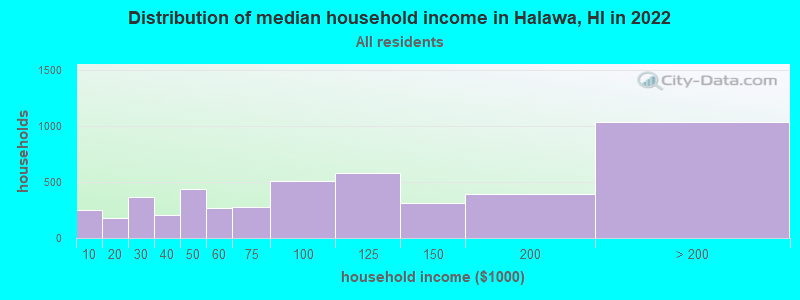
Halawa, HI household income distribution

- 254Less than $10,000
- 174$10,000 to $19,999
- 365$20,000 to $29,999
- 205$30,000 to $39,999
- 440$40,000 to $49,999
- 272$50,000 to $59,999
- 277$60,000 to $74,999
- 513$75,000 to $99,999
- 581$100,000 to $124,999
- 315$125,000 to $149,999
- 396$150,000 to $199,999
- 1,035$200,000 or more
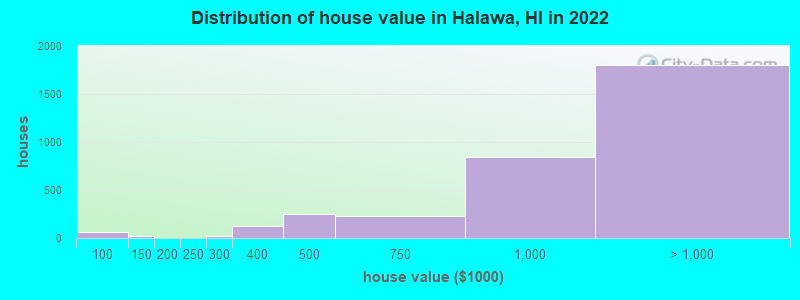
Home value of owner - occupied houses in 2022 in Halawa, HI
-
- 2$25,000 to $29,999
- 65$80,000 to $89,999
- 19$100,000 to $124,999
- 3$200,000 to $249,999
- 23$250,000 to $299,999
- 129$300,000 to $399,999
- 249$400,000 to $499,999
- 225$500,000 to $749,999
- 844$750,000 to $999,999
- 1,333$1,000,000 to $1,499,999
- 365$1,500,000 to $1,999,999
- 98$2,000,000 or more
Rent paid by renters in 2022 in Halawa, HI
-
- 7Less than $100
- 7$100 to $149
- 38$150 to $199
- 31$200 to $249
- 10$250 to $299
- 8$300 to $349
- 24$350 to $399
- 52$400 to $449
- 10$450 to $499
- 11$500 to $549
- 78$550 to $599
- 39$600 to $649
- 26$650 to $699
- 5$700 to $749
- 42$800 to $899
- 13$900 to $999
- 259$1,000 to $1,249
- 141$1,250 to $1,499
- 285$1,500 to $1,999
- 152$2,000 to $2,499
- 144$2,500 to $2,999
- 24$3,000 to $3,499
- 30$3,500 or more
- 121No cash rent


Percentage of workers working in this county: 99.3%
Number of people working at home: 482 (6.7% of all workers)
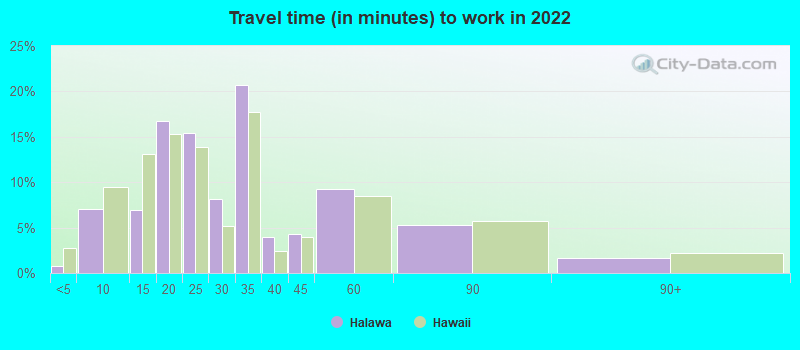
Travel time to work (commute)
- Less than 5 minutes: 104
- 5 to 9 minutes: 456
- 10 to 14 minutes: 981
- 15 to 19 minutes: 1,085
- 20 to 24 minutes: 1,206
- 25 to 29 minutes: 309
- 30 to 34 minutes: 1,704
- 35 to 39 minutes: 123
- 40 to 44 minutes: 64
- 45 to 59 minutes: 420
- 60 to 89 minutes: 179
- 90 or more minutes: 40
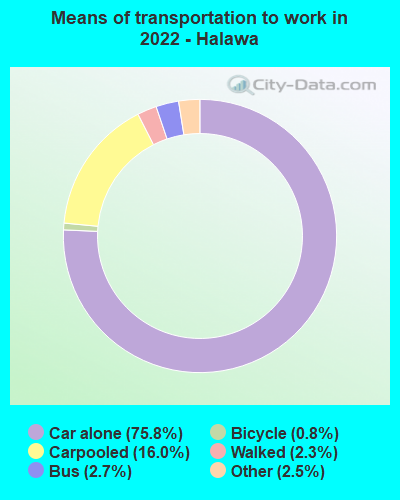
Means of transportation to work:
- Drove a car alone: 4,096 (67.9%)
- Carpooled: 990 (16.4%)
- Bus: 123 (2.0%)
- Taxi: 146 (2.4%)
- Bicycle: 49 (0.8%)
- Walked: 136 (2.3%)
- Worked at home: 482 (8.0%)

- Unemployment by race in 2022
- Unemployment rate for White non-Hispanic residents
- 10.7%Females
- Unemployment rate for Asian residents
- 2.2%Males
- 0.2%Females
- Unemployment rate for other race residents
- 49.4%Females
- Unemployment rate for two or more race residents
- 5.7%Males
- 1.7%Females
- Unemployment rate for Hispanic or Latino residents
- 1.9%Males
- 4.0%Females

- Year of entry for the foreign-born population in Halawa, Hawaii
- 5382010 or later
- 6382000 to 2009
- 5211990 to 1999
- 7171980 to 1989
- 7251970 to 1979
- 729Before 1970

First ancestries reported:
- American: 58 (0.8%)
- German: 56 (0.7%)
- African: 51 (0.7%)
- Irish: 19 (0.2%)
- English: 18 (0.2%)
- Portuguese: 13 (0.2%)
- Scottish: 8 (0.1%)
- Italian: 7 (0.09%)
- Nigerian: 7 (0.09%)
- French: 5 (0.07%)
- Eastern European: 3 (0.04%)
Most common places of birth for foreign-born residents (%):
| Halawa: | 40.4% (1,315) |
| Hawaii: | 44.3% (115,679) |
| Halawa: | 11.6% (378) |
| Hawaii: | 3.6% (9,389) |
| Halawa: | 11.6% (377) |
| Hawaii: | 2.4% (6,146) |
| Halawa: | 8.1% (264) |
| Hawaii: | 8.5% (22,321) |
| Halawa: | 5.4% (176) |
| Hawaii: | 7.6% (19,835) |
| Halawa: | 4.8% (155) |
| Hawaii: | 3.7% (9,622) |
| Halawa: | 4.4% (142) |
| Hawaii: | 5.9% (15,525) |
| Halawa: | 4.2% (136) |
| Hawaii: | 4.0% (10,430) |
| Halawa: | 2.3% (76) |
| Hawaii: | 0.1% (191) |
| Halawa: | 1.5% (49) |
| Hawaii: | 0.6% (1,617) |
Place of birth for U.S.-born residents:
- This state: 8,476
- Other state: 2,012
- Northeast: 216
- Midwest: 230
- South: 585
- West: 993
92.6% of Halawa residents lived in the same house 1 years ago.
Out of people who lived in different houses, 43.9% lived in this county.
Out of people who lived in different counties, 40.0% lived in Hawaii.
| Halawa: | 92.6% |
| State average: | 87.8% |
Education attainment for males 25 years and older:
- No schooling: 87
- Nursery to 4th grade: 13
- 5th and 6th grade: 22
- 7th and 8th grade: 17
- 9th grade: 76
- 10th grade: 10
- 11th grade: 37
- 12th grade, no diploma: 153
- High school graduate (or equivalency): 1,521
- Less than 1 year of college: 388
- Some college more than 1 year, no degree: 826
- Associate degree: 520
- Bachelor's degree: 972
- Master's degree: 322
- Professional school degree: 72
- Doctorate degree: 53

Education attainment for females 25 years and older:
- No schooling: 112
- Nursery to 4th grade: 0
- 5th and 6th grade: 31
- 7th and 8th grade: 31
- 9th grade: 14
- 10th grade: 43
- 11th grade: 80
- 12th grade, no diploma: 56
- High school graduate (or equivalency): 1,471
- Less than 1 year of college: 326
- Some college more than 1 year, no degree: 705
- Associate degree: 542
- Bachelor's degree: 1,255
- Master's degree: 462
- Professional school degree: 110
- Doctorate degree: 227


Housing units in structures:
- One, detached: 2,969
- One, attached: 409
- Two: 56
- 3 or 4: 286
- 5 to 9: 434
- 10 to 19: 474
- 20 to 49: 49
- 50 or more: 326
Housing units lacking complete kitchen facilities in 2022: 0.8%
House/condo owner moved in on average 28 years ago
Renter moved in on average 5 years ago

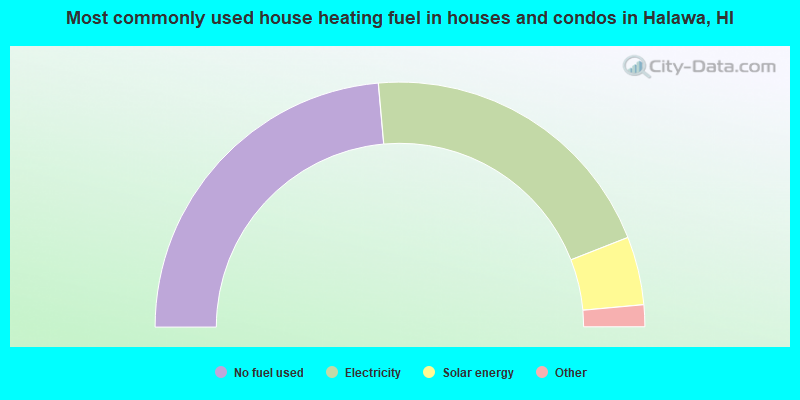
- 47.2%No fuel used
- 40.9%Electricity
- 9.0%Solar energy
- 2.3%Utility gas
- 0.6%Bottled, tank, or LP gas
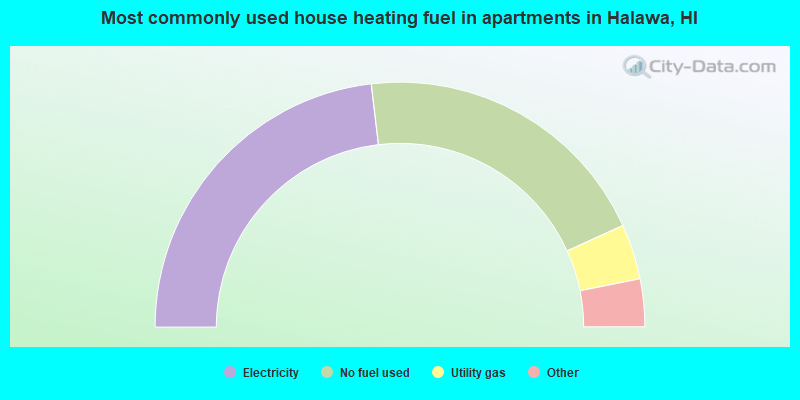
- 46.3%Electricity
- 40.2%No fuel used
- 7.3%Utility gas
- 2.9%Solar energy
- 1.7%Bottled, tank, or LP gas
- 1.6%Other fuel
Private vs. public school enrollment:
| Here: | 22.5% |
| Hawaii: | 21.6% |
| Here: | 40.8% |
| Hawaii: | 21.5% |
| Here: | 24.5% |
| Hawaii: | 23.3% |


