Countryside, IL (Illinois) Houses and Residents
| Countryside: | $311,149 |
| Illinois: | $251,600 |
Total population: 6,023 (Urban population: 5,975, Rural population: 0)
Houses: 3,016 (2,814 occupied: 1,981 owner occupied, 881 renter occupied)
| % of renters here: | 31% |
| State: | 33% |
Housing density: 1,121 houses/condos per square mile
Median price asked for vacant for-sale houses and condos in 2022 in this county: $235,866.
Median contract rent in 2022: $1,037 (lower quartile is $903, upper quartile is $1,215)
Median rent asked for vacant for-rent units in 2022: $1,959
Median gross rent in Countryside, IL in 2022: $1,144
Housing units in Countryside with a mortgage: 1,114 (170 second mortgage, 0 home equity loan, 155 both second mortgage and home equity loan)
Houses without a mortgage: 17
Median household income for houses/condos with a mortgage: $90,503
Median household income for apartments without a mortgage: $96,657
Median monthly housing costs: $1,182
Compare current foreclosures near Countryside, IL:
| Photo | Address | Area | Beds / Baths | Price | Details |
|---|---|---|---|---|---|

|
#1
Webster Ln
Des Plaines, IL 60018
|
1,608 sq. feet
|
3 baths 3 beds |
$500,000
|
show details |

|
#2
W 108th St Apt D
Chicago, IL 60643
|
1,300 sq. feet
|
2 baths 3 beds |
$144,900
|
show details |

|
#3
S Greenwood Ave
Chicago, IL 60628
|
1,344 sq. feet
|
2 baths 4 beds |
$115,500
|
show details |

|
#4
S Meade Ave
Palos Heights, IL 60463
|
1,656 sq. feet
|
1 baths 3 beds |
$289,900
|
show details |

|
#5
S 90th Ct # 1a
Orland Park, IL 60462
|
1,100 sq. feet
|
1 baths 2 beds |
$270,000
|
show details |

|
#6
N Austin Ave
Chicago, IL 60634
|
2,500 sq. feet
|
3 baths 4 beds |
$365,000
|
show details |

|
#7
- 24 S Kimbark Unit 105
Chicago, IL 60637
|
600 sq. feet
|
1 baths 1 beds |
$137,000
|
show details |

|
#8
W Arquilla Dr
Palos Heights, IL 60463
|
1,780 sq. feet
|
2 baths 2 beds |
$299,900
|
show details |

|
#9
S Bennett Ave
Chicago, IL 60617
|
1,052 sq. feet
|
1 baths 3 beds |
$265,000
|
show details |

|
#10
E 46th St
Chicago, IL 60653
|
2,126 sq. feet
|
2 baths 2 beds |
$289,000
|
show details |
| Photo | Address | Area | Beds / Baths | Price | Details |
|---|---|---|---|---|---|

|
#11
E 56th St Apt 5w
Chicago, IL 60637
|
- sq. feet
|
1 baths 2 beds |
$156,000
|
show details |

|
#12
S Yale Ave
Chicago, IL 60628
|
1,608 sq. feet
|
2 baths 3 beds |
$262,000
|
show details |

|
#13
Raymond Ave
Brookfield, IL 60513
|
1,020 sq. feet
|
1 baths 2 beds |
$219,900
|
show details |

|
#14
W Van Buren St
Chicago, IL 60644
|
2,839 sq. feet
|
3 baths 8 beds |
$87,500
|
show details |

|
#15
W Garfield Blvd
Chicago, IL 60636
|
2,820 sq. feet
|
2 baths 5 beds |
$119,900
|
show details |

|
#16
Division St
Blue Island, IL 60406
|
1,683 sq. feet
|
1 baths 2 beds |
$119,600
|
show details |

|
#17
Newcastle Ave
Westchester, IL 60154
|
1,640 sq. feet
|
1 baths 2 beds |
$219,900
|
show details |

|
#18
W 107th Pl
Chicago, IL 60628
|
1,579 sq. feet
|
2 baths 6 beds |
$40,000
|
show details |

|
#19
W Barry Ave Apt 3bc
Chicago, IL 60657
|
2,500 sq. feet
|
3 baths 4 beds |
$685,000
|
show details |

|
#20
S Main St
Hometown, IL 60456
|
744 sq. feet
|
1 baths 2 beds |
$175,000
|
show details |
| Photo | Address | Area | Beds / Baths | Price | Details |
|---|---|---|---|---|---|

|
#21
S Normal Ave
Chicago, IL 60628
|
989 sq. feet
|
1 baths 3 beds |
$154,375
|
show details |

|
#22
S Crandon Ave # 319
Chicago, IL 60649
|
1,271 sq. feet
|
2 baths 2 beds |
$146,900
|
show details |

|
#23
S South Shore Dr Apt 1201
Chicago, IL 60649
|
1,100 sq. feet
|
2 baths 2 beds |
$179,000
|
show details |

|
#24
S Vanderpoel Ave
Chicago, IL 60643
|
2,352 sq. feet
|
2 baths 7 beds |
$115,000
|
show details |

|
#25
Lincoln Ave
Dolton, IL 60419
|
1,966 sq. feet
|
2 baths 3 beds |
$69,900
|
show details |

|
#26
S Union Ave
Chicago, IL 60620
|
1,920 sq. feet
|
2 baths 4 beds |
$75,000
|
show details |

|
#27
S Ingleside Ave
Chicago, IL 60628
|
1,584 sq. feet
|
2 baths 3 beds |
$131,750
|
show details |

|
#28
S Calumet Ave
Chicago, IL 60628
|
3,690 sq. feet
|
3 baths 6 beds |
$260,000
|
show details |

|
#29
S Tripp Ave
Oak Lawn, IL 60453
|
1,591 sq. feet
|
1 baths 3 beds |
$212,000
|
show details |

|
#30
E Crest Ave
Addison, IL 60101
|
2,023 sq. feet
|
1 baths 5 beds |
$296,100
|
show details |
| Photo | Address | Area | Beds / Baths | Price | Details |
|---|---|---|---|---|---|

|
#31
W 25th Pl
Chicago, IL 60623
|
- sq. feet
|
2 baths 4 beds |
$199,900
|
show details |

|
#32
N Olcott Ave
Chicago, IL 60634
|
2,161 sq. feet
|
2 baths 4 beds |
$559,000
|
show details |

|
#33
W 63rd St
Chicago, IL 60638
|
1,250 sq. feet
|
2 baths 4 beds |
$375,000
|
show details |

|
#34
145th St
Midlothian, IL 60445
|
2,000 sq. feet
|
1 baths 3 beds |
$179,900
|
show details |

|
#35
Whitman Ave
Hazel Crest, IL 60429
|
1,360 sq. feet
|
2 baths 2 beds |
$137,900
|
show details |

|
#36
W 100th Pl
Chicago, IL 60628
|
971 sq. feet
|
1 baths 2 beds |
$225,000
|
show details |

|
#37
Avenida Serra Test
Des Plaines, IL 60018
|
- sq. feet
|
2 baths 3 beds |
$100,000
|
show details |

|
#38
S Drexel Ave Unit 2d
Chicago, IL 60615
|
- sq. feet
|
2 baths 3 beds |
$109,900
|
show details |

|
#39
Washington Blvd Apt 1
Oak Park, IL 60302
|
- sq. feet
|
1 baths 2 beds |
$134,900
|
show details |

|
#40
W 118th St
Chicago, IL 60628
|
- sq. feet
|
2 baths 4 beds |
$145,900
|
show details |
| Photo | Address | Area | Beds / Baths | Price | Details |
|---|---|---|---|---|---|

|
#41
W Quincy St
Chicago, IL 60644
|
960 sq. feet
|
1 baths - beds |
$19,000
|
show details |

|
#42
S Charles St
Chicago, IL 60643
|
- sq. feet
|
4 baths 6 beds |
$349,900
|
show details |

|
#43
W Arthington St
Chicago, IL 60612
|
969 sq. feet
|
1 baths - beds |
$20,000
|
show details |

|
#44
Fairfax Ave
Romeoville, IL 60446
|
- sq. feet
|
1 baths 3 beds |
$229,900
|
show details |

|
#45
W 18th St
Chicago, IL 60608
|
2,571 sq. feet
|
4 baths 6 beds |
show details | |

|
#46
W North Ave
Chicago, IL 60647
|
4,290 sq. feet
|
3 baths 2 beds |
show details | |

|
#47
W Irving Park Rd Apt 4
Chicago, IL 60613
|
1,800 sq. feet
|
2 baths 3 beds |
show details | |

|
#48
W 47th St
Chicago, IL 60609
|
2,800 sq. feet
|
5 baths 4 beds |
show details | |

|
#49
S Wabash Ave
Chicago, IL 60637
|
3,870 sq. feet
|
3 baths 6 beds |
show details | |

|
Check over 1 million property listings on Foreclosure.com!
|
browse all offers | |||

Latest news about housing in Countryside, IL collected exclusively by city-data.com from local newspapers, TV, and radio stations

 | What About Westchester Illinois? (76 replies) |
| Chicago Suburbs Housing Market on the up and up? (30 replies) |
| Most In-Demand Suburb for Single Family Homes? (18 replies) |
| Does anyone think we're entering another real estate bubble? (220 replies) |
| Suburbs of Suburbs (32 replies) |
| Are suburbs growing in popularity because of Covid? (41 replies) |

Median year apartment built: 1979
Household type by relationship:
Households: 6,181- Male householders: 1,383 (484 living alone), Female householders: 1,357 (440 living alone)
1,129 spouses (1,112 opposite-sex spouses), 141 unmarried partners, (141 opposite-sex unmarried partners), 1,740 children (1,716 natural, 0 adopted, 23 stepchildren), 63 grandchildren, 56 brothers or sisters, 176 parents, 0 foster children, 66 other relatives, 44 non-relatives
- In group quarters: 21
Size of family households: 885 2-persons, 367 3-persons, 326 4-persons, 39 5-persons, 97 6-persons, 10 7-or-more-persons.
Size of nonfamily households: 993 1-person, 133 2-persons, 8 4-persons.
644 married couples with children.
341 single-parent households (0 men, 341 women).
71.7% of residents of Countryside speak English at home.
13.9% of residents speak Spanish at home (65% speak English very well, 25% speak English well, 10% speak English not well).
11.5% of residents speak other Indo-European language at home (61% speak English very well, 33% speak English well, 6% speak English not well).
3.0% of residents speak Asian or Pacific Island language at home (83% speak English very well, 6% speak English well, 11% speak English not well).
0.3% of residents speak other language at home (100% speak English very well).
Foreign born population: 1,310 (21.2%)
(49.2% of them are naturalized citizens)
| Here: | 6.0 |
| State: | 6.4 |
| Here: | 3.9 |
| State: | 4.1 |

- Bedrooms in owner-occupied houses and condos in Countryside, Illinois
- 0no bedroom
- 2161 bedroom
- 6092 bedrooms
- 7383 bedrooms
- 3404 bedrooms
- 795+ bedrooms

- Bedrooms in renter-occupied apartments in Countryside, Illinois
- 60no bedroom
- 3461 bedroom
- 2382 bedrooms
- 1763 bedrooms
- 524 bedrooms
- 95+ bedrooms

- Cars and other vehicles available in Countryside in owner-occupied houses/condos
- 21no vehicle
- 8261 vehicle
- 7852 vehicles
- 1943 vehicles
- 1174 vehicles
- 375+ vehicles

- Cars and other vehicles available in Countryside in renter-occupied apartments
- 31no vehicle
- 5921 vehicle
- 2332 vehicles
- 03 vehicles
- 264 vehicles
- 05+ vehicles

- Rooms in owner-occupied houses in Countryside, Illinois
- 01 room
- 882 rooms
- 1853 rooms
- 2534 rooms
- 2815 rooms
- 4066 rooms
- 3217 rooms
- 1878 rooms
- 2619+ rooms

- Rooms in renter-occupied apartments in Countryside, Illinois
- 601 room
- 682 rooms
- 2083 rooms
- 1924 rooms
- 2285 rooms
- 466 rooms
- 627 rooms
- 78 rooms
- 99+ rooms


Countryside, IL household income distribution

- 82Less than $10,000
- 156$10,000 to $19,999
- 171$20,000 to $29,999
- 152$30,000 to $39,999
- 211$40,000 to $49,999
- 173$50,000 to $59,999
- 426$60,000 to $74,999
- 383$75,000 to $99,999
- 226$100,000 to $124,999
- 229$125,000 to $149,999
- 231$150,000 to $199,999
- 418$200,000 or more

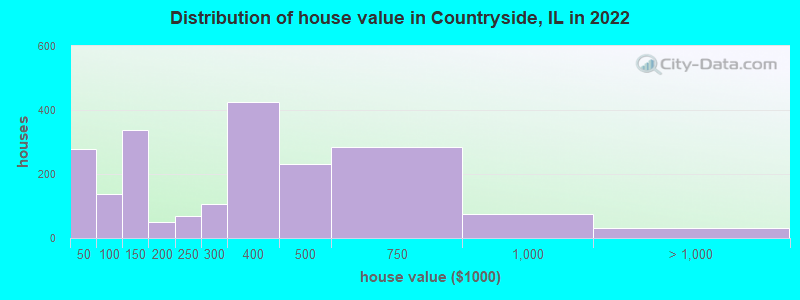
Home value of owner - occupied houses in 2022 in Countryside, IL
-
- 32Less than $10,000
- 20$10,000 to $14,999
- 23$20,000 to $24,999
- 39$25,000 to $29,999
- 35$30,000 to $34,999
- 74$35,000 to $39,999
- 50$40,000 to $49,999
- 13$60,000 to $69,999
- 30$70,000 to $79,999
- 42$90,000 to $99,999
- 153$100,000 to $124,999
- 185$125,000 to $149,999
- 50$150,000 to $174,999
- 69$200,000 to $249,999
- 107$250,000 to $299,999
- 423$300,000 to $399,999
- 231$400,000 to $499,999
- 284$500,000 to $749,999
- 74$750,000 to $999,999
- 30$1,000,000 to $1,499,999
Rent paid by renters in 2022 in Countryside, IL
-
- 21$200 to $249
- 12$600 to $649
- 45$700 to $749
- 57$750 to $799
- 73$800 to $899
- 165$900 to $999
- 314$1,000 to $1,249
- 40$1,250 to $1,499
- 32$1,500 to $1,999
- 58$2,000 to $2,499
- 32$2,500 to $2,999
- 35No cash rent


Percentage of workers working in this county: 77.1%
Number of people working at home: 460 (13.5% of all workers)
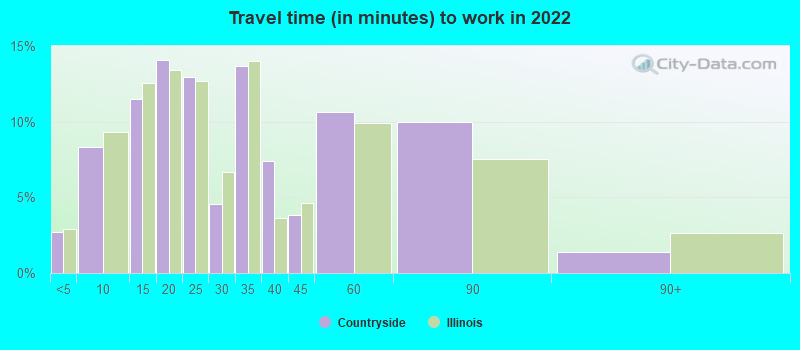
Travel time to work (commute)
- Less than 5 minutes: 100
- 5 to 9 minutes: 323
- 10 to 14 minutes: 392
- 15 to 19 minutes: 339
- 20 to 24 minutes: 268
- 25 to 29 minutes: 182
- 30 to 34 minutes: 433
- 35 to 39 minutes: 143
- 40 to 44 minutes: 157
- 45 to 59 minutes: 321
- 60 to 89 minutes: 189
- 90 or more minutes: 59
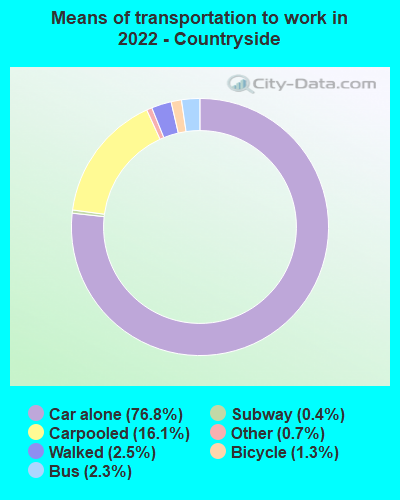
Means of transportation to work:
- Drove a car alone: 4,549 (70.4%)
- Carpooled: 1,023 (15.8%)
- Bus: 123 (1.9%)
- Long-distance train or commuter rail: 18 (0.3%)
- Taxi: 40 (0.6%)
- Bicycle: 81 (1.3%)
- Walked: 151 (2.3%)
- Worked at home: 460 (7.1%)

- Unemployment by race in 2022
- Unemployment rate for White non-Hispanic residents
- 6.9%Males
- 4.3%Females
- Unemployment rate for two or more race residents
- 3.2%Females
- Unemployment rate for Hispanic or Latino residents
- 19.0%Males
- 1.8%Females

- Year of entry for the foreign-born population in Countryside, Illinois
- 3902010 or later
- 2752000 to 2009
- 2781990 to 1999
- 1921980 to 1989
- 1021970 to 1979
- 245Before 1970

First ancestries reported:
- Polish: 294 (10.4%)
- Macedonian: 235 (8.3%)
- Italian: 159 (5.6%)
- Irish: 138 (4.9%)
- German: 132 (4.7%)
- Czech: 94 (3.3%)
- Serbian: 90 (3.2%)
- Croatian: 87 (3.1%)
- Yugoslavian: 68 (2.4%)
- English: 60 (2.1%)
- Northern European: 54 (1.9%)
- Austrian: 52 (1.8%)
- Swedish: 45 (1.6%)
- Lithuanian: 44 (1.6%)
- American: 39 (1.4%)
- European: 38 (1.3%)
- Dutch: 32 (1.1%)
- Turkish: 32 (1.1%)
- Eastern European: 15 (0.5%)
- Ukrainian: 15 (0.5%)
- Russian: 14 (0.5%)
- Greek: 7 (0.2%)
- Czechoslovakian: 6 (0.2%)
Most common places of birth for foreign-born residents (%):
| Countryside: | 33.1% (434) |
| Illinois: | 34.7% (626,958) |
| Countryside: | 16.2% (212) |
| Illinois: | 0.2% (4,211) |
| Countryside: | 14.8% (194) |
| Illinois: | 0.5% (8,574) |
| Countryside: | 7.9% (103) |
| Illinois: | 0.6% (10,776) |
| Countryside: | 5.1% (67) |
| Illinois: | 0.9% (16,844) |
| Countryside: | 4.7% (61) |
| Illinois: | 6.9% (124,474) |
| Countryside: | 4.4% (57) |
| Illinois: | 5.2% (93,003) |
| Countryside: | 2.9% (38) |
| Illinois: | 0.2% (3,977) |
| Countryside: | 2.6% (34) |
| Illinois: | 4.1% (74,364) |
| Countryside: | 1.9% (25) |
| Illinois: | 0.9% (16,553) |
| Countryside: | 1.5% (20) |
| Illinois: | 0.3% (4,823) |
Place of birth for U.S.-born residents:
- This state: 4,030
- Other state: 822
- Northeast: 113
- Midwest: 410
- South: 190
- West: 112
90.8% of Countryside residents lived in the same house 1 years ago.
Out of people who lived in different houses, 43.6% lived in this county.
Out of people who lived in different counties, 60.4% lived in Illinois.
| Countryside: | 90.8% |
| State average: | 88.3% |
Education attainment for males 25 years and older:
- No schooling: 170
- Nursery to 4th grade: 7
- 5th and 6th grade: 0
- 7th and 8th grade: 37
- 9th grade: 0
- 10th grade: 0
- 11th grade: 0
- 12th grade, no diploma: 65
- High school graduate (or equivalency): 374
- Less than 1 year of college: 193
- Some college more than 1 year, no degree: 382
- Associate degree: 137
- Bachelor's degree: 477
- Master's degree: 224
- Professional school degree: 38
- Doctorate degree: 59

Education attainment for females 25 years and older:
- No schooling: 28
- Nursery to 4th grade: 0
- 5th and 6th grade: 13
- 7th and 8th grade: 17
- 9th grade: 0
- 10th grade: 0
- 11th grade: 1
- 12th grade, no diploma: 77
- High school graduate (or equivalency): 702
- Less than 1 year of college: 260
- Some college more than 1 year, no degree: 271
- Associate degree: 148
- Bachelor's degree: 531
- Master's degree: 284
- Professional school degree: 65
- Doctorate degree: 33


Housing units in structures:
- One, detached: 1,261
- One, attached: 122
- Two: 52
- 3 or 4: 79
- 5 to 9: 194
- 10 to 19: 283
- 20 to 49: 579
- 50 or more: 181
- Mobile homes: 262
Median worth of mobile homes: $35,894
Housing units lacking complete kitchen facilities in 2022: 0.8%
House/condo owner moved in on average 16 years ago
Renter moved in on average 1 years ago

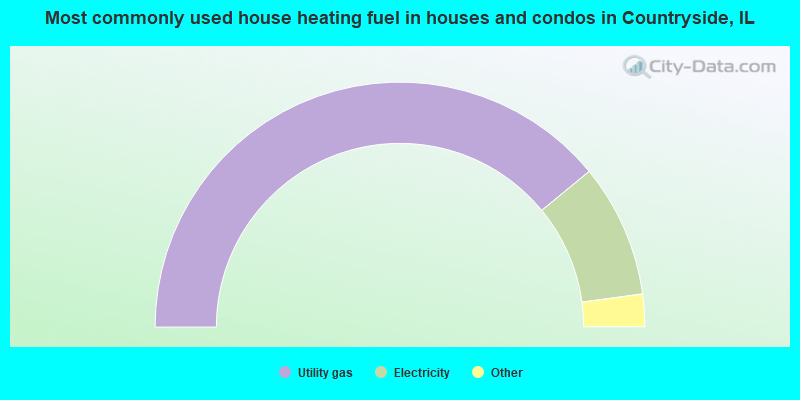
- 78.1%Utility gas
- 17.6%Electricity
- 2.6%Other fuel
- 1.6%No fuel used
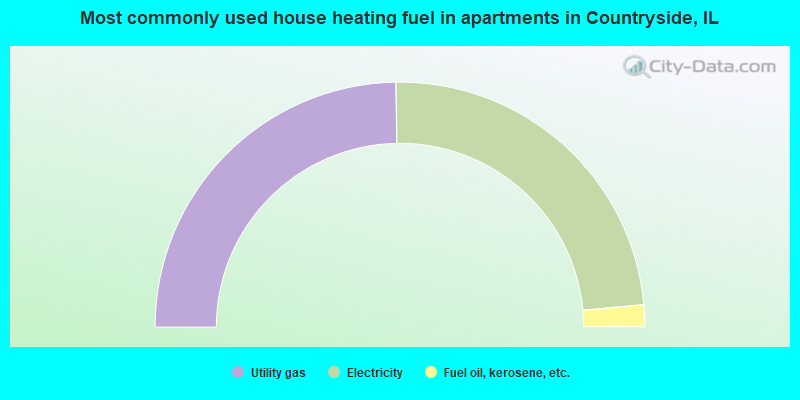
- 49.5%Utility gas
- 47.6%Electricity
- 2.9%Fuel oil, kerosene, etc.
Private vs. public school enrollment:
| Here: | 40.4% |
| Illinois: | 13.3% |
| Here: | 3.9% |
| Illinois: | 9.9% |
| Here: | 21.2% |
| Illinois: | 27.4% |


