Claremont, CA (California) Houses and Residents
| Claremont: | $919,475 |
| California: | $715,900 |
Total population: 36,054 (Urban population: 32,900, Rural population: 1,078 (all nonfarm))
Houses: 13,327 (12,751 occupied: 8,334 owner occupied, 4,465 renter occupied)
| % of renters here: | 35% |
| State: | 44% |
Housing density: 1,014 houses/condos per square mile
Median price asked for vacant for-sale houses and condos in 2022: $764,390.
Median contract rent in 2022: $1,863 (lower quartile is $1,336, upper quartile is over $2,000)
Median rent asked for vacant for-rent units in 2022: $1,509
Median gross rent in Claremont, CA in 2022: $1,969
Housing units in Claremont with a mortgage: 5,626 (724 second mortgage, 6 home equity loan, 598 both second mortgage and home equity loan)
Houses without a mortgage: 38
Median household income for houses/condos with a mortgage: $168,263
Median household income for apartments without a mortgage: $119,981
Median monthly housing costs: $2,216
Compare current foreclosures near Claremont, CA:
| Photo | Address | Area | Beds / Baths | Price | Details |
|---|---|---|---|---|---|

|
#1
S Indian Hill Blvd Apt B
Claremont, CA 91711
|
1,088 sq. feet
|
2 baths 2 beds |
show details | |

|
#2
Scripps Dr
Claremont, CA 91711
|
1,568 sq. feet
|
2 baths 3 beds |
show details | |

|
#3
Lander Cir
Claremont, CA 91711
|
1,469 sq. feet
|
2 baths 3 beds |
show details | |

|
#4
Lander Cir
Claremont, CA 91711
|
1,475 sq. feet
|
3 baths 3 beds |
show details | |

|
#5
Geneva Ave
Claremont, CA 91711
|
1,359 sq. feet
|
2 baths 3 beds |
show details | |

|
#6
Belhaven Pl
Claremont, CA 91711
|
1,308 sq. feet
|
2 baths 3 beds |
show details | |

|
#7
Alamosa Dr
Claremont, CA 91711
|
1,188 sq. feet
|
2 baths 3 beds |
show details | |

|
#8
Hollins Ave
Claremont, CA 91711
|
7,018 sq. feet
|
5 baths 6 beds |
show details | |

|
#9
Padua Ave
Claremont, CA 91711
|
3,196 sq. feet
|
4 baths 3 beds |
show details | |

|
#10
Kenyon Pl
Claremont, CA 91711
|
1,878 sq. feet
|
3 baths 4 beds |
show details |
| Photo | Address | Area | Beds / Baths | Price | Details |
|---|---|---|---|---|---|

|
#11
W San Jose Ave
Claremont, CA 91711
|
- sq. feet
|
- baths - beds |
show details | |

|
#12
W San Jose Ave Apt B
Claremont, CA 91711
|
- sq. feet
|
- baths - beds |
show details | |

|
#13
Lafayette Rd Apt T
Claremont, CA 91711
|
- sq. feet
|
- baths - beds |
show details | |

|
#14
Harrison Ave
Claremont, CA 91711
|
- sq. feet
|
- baths - beds |
show details | |

|
#15
Montgomery Cir Apt A
Claremont, CA 91711
|
- sq. feet
|
- baths - beds |
show details | |

|
#16
W Foothill Blvd Ste 310
Claremont, CA 91711
|
- sq. feet
|
- baths - beds |
show details | |

|
#17
Millbury Ave
Baldwin Park, CA 91706
|
1,632 sq. feet
|
2 baths 4 beds |
$850,000
|
show details |

|
#18
Victoria St
Rancho Cucamonga, CA 91701
|
3,412 sq. feet
|
2 baths 4 beds |
$951,600
|
show details |

|
#19
E Norma Ave
West Covina, CA 91791
|
1,134 sq. feet
|
2 baths 3 beds |
$599,000
|
show details |

|
#20
S Indian Hill Blvd Apt B
Claremont, CA 91711
|
- sq. feet
|
- baths - beds |
show details |
| Photo | Address | Area | Beds / Baths | Price | Details |
|---|---|---|---|---|---|

|
#21
E Holton St
West Covina, CA 91791
|
- sq. feet
|
2 baths 3 beds |
$450,000
|
show details |

|
#22
Celebration St
Chino, CA 91708
|
1,644 sq. feet
|
2 baths 3 beds |
show details | |

|
#23
Baxter Dr
Glendora, CA 91741
|
1,690 sq. feet
|
2 baths 4 beds |
show details | |

|
#24
Marlatt St
Mira Loma, CA 91752
|
1,166 sq. feet
|
1 baths 3 beds |
show details | |

|
#25
Long View Dr
Fontana, CA 92337
|
1,560 sq. feet
|
2 baths 3 beds |
show details | |

|
#26
Ravenna Ct
Chino Hills, CA 91709
|
2,571 sq. feet
|
3 baths 4 beds |
show details | |

|
#27
S Rama Dr
West Covina, CA 91790
|
1,527 sq. feet
|
2 baths 3 beds |
show details | |

|
#28
Huntsman Pl
Fontana, CA 92336
|
3,216 sq. feet
|
4 baths 5 beds |
show details | |

|
#29
Ladera Ct
Rancho Cucamonga, CA 91730
|
2,585 sq. feet
|
4 baths 4 beds |
show details | |

|
#30
Calle Ciervos
San Dimas, CA 91773
|
1,825 sq. feet
|
2 baths 3 beds |
show details |
| Photo | Address | Area | Beds / Baths | Price | Details |
|---|---|---|---|---|---|

|
#31
Cambria St
Fontana, CA 92335
|
1,722 sq. feet
|
2 baths 4 beds |
show details | |

|
#32
Highstone Way
Fontana, CA 92336
|
2,735 sq. feet
|
3 baths 4 beds |
show details | |

|
#33
Bower Cascade Pl
Diamond Bar, CA 91765
|
2,401 sq. feet
|
3 baths 5 beds |
show details | |

|
#34
Claraday St Apt 9
Glendora, CA 91740
|
1,263 sq. feet
|
3 baths 3 beds |
show details | |

|
#35
Saint Malo Ave
La Puente, CA 91744
|
1,060 sq. feet
|
2 baths 3 beds |
show details | |

|
#36
Homestead Dr
Rancho Cucamonga, CA 91730
|
3,886 sq. feet
|
3 baths 4 beds |
show details | |

|
#37
Poppy Ct
Fontana, CA 92336
|
2,098 sq. feet
|
3 baths 4 beds |
show details | |

|
#38
Humphreys Way
Glendora, CA 91741
|
1,684 sq. feet
|
2 baths 3 beds |
show details | |

|
#39
N Lyman Ave
Covina, CA 91724
|
1,230 sq. feet
|
2 baths 3 beds |
show details | |

|
#40
Laredo Pl
Rancho Cucamonga, CA 91737
|
4,181 sq. feet
|
5 baths 5 beds |
show details |
| Photo | Address | Area | Beds / Baths | Price | Details |
|---|---|---|---|---|---|

|
#41
S Concord Pl
Ontario, CA 91761
|
1,448 sq. feet
|
2 baths 3 beds |
show details | |

|
#42
Paddy Ln
Baldwin Park, CA 91706
|
1,141 sq. feet
|
2 baths 3 beds |
show details | |

|
#43
Inyo St
La Puente, CA 91744
|
1,000 sq. feet
|
2 baths 3 beds |
show details | |

|
#44
Featherwood Dr
Diamond Bar, CA 91765
|
1,384 sq. feet
|
2 baths 3 beds |
show details | |

|
#45
Palo Alto St
Rancho Cucamonga, CA 91730
|
1,836 sq. feet
|
2 baths 5 beds |
show details | |

|
#46
Golden Springs Dr Unit E
Diamond Bar, CA 91765
|
1,071 sq. feet
|
2 baths 2 beds |
show details | |

|
#47
San Antonio Ave
Chino, CA 91710
|
1,666 sq. feet
|
2 baths 3 beds |
show details | |

|
#48
Cherry Pl
Ontario, CA 91761
|
1,538 sq. feet
|
2 baths 4 beds |
show details | |

|
#49
Hellman Ave # 4
Rancho Cucamonga, CA 91730
|
2,060 sq. feet
|
4 baths 4 beds |
show details | |

|
Check over 1 million property listings on Foreclosure.com!
|
browse all offers | |||

Latest news about housing in Claremont, CA collected exclusively by city-data.com from local newspapers, TV, and radio stations


Median year apartment built: 1970
Household type by relationship:
Households: 36,090- Male householders: 5,833 (592 living alone), Female householders: 6,495 (2,327 living alone)
6,900 spouses (6,777 opposite-sex spouses), 438 unmarried partners, (368 opposite-sex unmarried partners), 9,357 children (9,074 natural, 28 adopted, 254 stepchildren), 536 grandchildren, 333 brothers or sisters, 530 parents, 0 foster children, 357 other relatives, 838 non-relatives
- In group quarters: 4,469
Size of family households: 4,221 2-persons, 2,213 3-persons, 1,649 4-persons, 741 5-persons, 142 6-persons, 57 7-or-more-persons.
Size of nonfamily households: 3,132 1-person, 561 2-persons, 132 3-persons.
4,327 married couples with children.
938 single-parent households (149 men, 789 women).
74.3% of residents of Claremont speak English at home.
11.5% of residents speak Spanish at home (79% speak English very well, 15% speak English well, 4% speak English not well, 1% don't speak English at all).
3.7% of residents speak other Indo-European language at home (90% speak English very well, 7% speak English well, 3% speak English not well).
10.6% of residents speak Asian or Pacific Island language at home (55% speak English very well, 30% speak English well, 10% speak English not well, 5% don't speak English at all).
1.1% of residents speak other language at home (86% speak English very well, 12% speak English well, 2% don't speak English at all).
Foreign born population: 6,184 (17.1%)
(70.1% of them are naturalized citizens)
| Here: | 6.7 |
| State: | 6.0 |
| Here: | 4.1 |
| State: | 3.9 |

- Bedrooms in owner-occupied houses and condos in Claremont, California
- 19no bedroom
- 281 bedroom
- 5702 bedrooms
- 3,9233 bedrooms
- 3,1354 bedrooms
- 6585+ bedrooms

- Bedrooms in renter-occupied apartments in Claremont, California
- 123no bedroom
- 1,3211 bedroom
- 1,8772 bedrooms
- 8573 bedrooms
- 2244 bedrooms
- 635+ bedrooms

- Cars and other vehicles available in Claremont in owner-occupied houses/condos
- 137no vehicle
- 1,6451 vehicle
- 3,5682 vehicles
- 1,9543 vehicles
- 5954 vehicles
- 4355+ vehicles

- Cars and other vehicles available in Claremont in renter-occupied apartments
- 697no vehicle
- 2,1271 vehicle
- 1,2262 vehicles
- 3793 vehicles
- 224 vehicles
- 155+ vehicles

- Rooms in owner-occupied houses in Claremont, California
- 191 room
- 02 rooms
- 893 rooms
- 2644 rooms
- 1,3895 rooms
- 1,8476 rooms
- 1,8837 rooms
- 1,2678 rooms
- 1,5759+ rooms

- Rooms in renter-occupied apartments in Claremont, California
- 1231 room
- 3922 rooms
- 9733 rooms
- 1,2554 rooms
- 6855 rooms
- 6126 rooms
- 1887 rooms
- 968 rooms
- 1419+ rooms


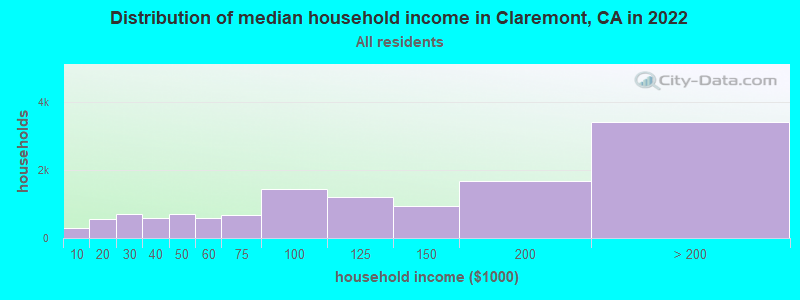
Claremont, CA household income distribution

- 309Less than $10,000
- 549$10,000 to $19,999
- 702$20,000 to $29,999
- 585$30,000 to $39,999
- 693$40,000 to $49,999
- 595$50,000 to $59,999
- 668$60,000 to $74,999
- 1,430$75,000 to $99,999
- 1,210$100,000 to $124,999
- 932$125,000 to $149,999
- 1,681$150,000 to $199,999
- 3,416$200,000 or more
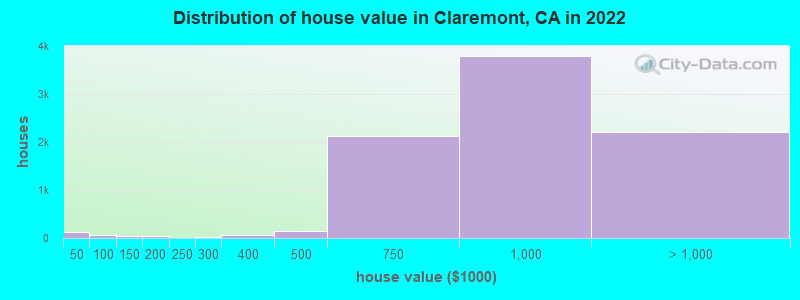
Home value of owner - occupied houses in 2022 in Claremont, CA
-
- 110Less than $10,000
- 15$20,000 to $24,999
- 15$50,000 to $59,999
- 23$70,000 to $79,999
- 26$80,000 to $89,999
- 46$100,000 to $124,999
- 2$125,000 to $149,999
- 30$150,000 to $174,999
- 9$175,000 to $199,999
- 16$250,000 to $299,999
- 65$300,000 to $399,999
- 149$400,000 to $499,999
- 2,133$500,000 to $749,999
- 3,794$750,000 to $999,999
- 1,560$1,000,000 to $1,499,999
- 257$1,500,000 to $1,999,999
- 394$2,000,000 or more
Rent paid by renters in 2022 in Claremont, CA
-
- 106$250 to $299
- 91$400 to $449
- 23$450 to $499
- 12$500 to $549
- 29$550 to $599
- 25$700 to $749
- 205$800 to $899
- 136$900 to $999
- 316$1,000 to $1,249
- 416$1,250 to $1,499
- 1,219$1,500 to $1,999
- 920$2,000 to $2,499
- 492$2,500 to $2,999
- 284$3,000 to $3,499
- 139$3,500 or more
- 92No cash rent


Percentage of workers working in this county: 72.3%
Number of people working at home: 4,708 (27.6% of all workers)
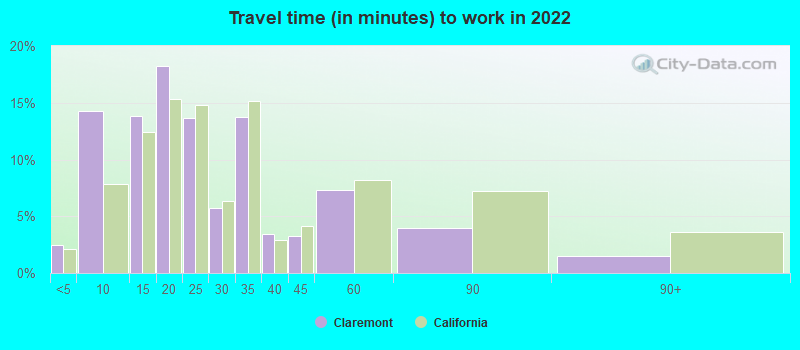
Travel time to work (commute)
- Less than 5 minutes: 367
- 5 to 9 minutes: 1,844
- 10 to 14 minutes: 1,645
- 15 to 19 minutes: 1,903
- 20 to 24 minutes: 1,390
- 25 to 29 minutes: 646
- 30 to 34 minutes: 1,812
- 35 to 39 minutes: 473
- 40 to 44 minutes: 530
- 45 to 59 minutes: 917
- 60 to 89 minutes: 968
- 90 or more minutes: 416
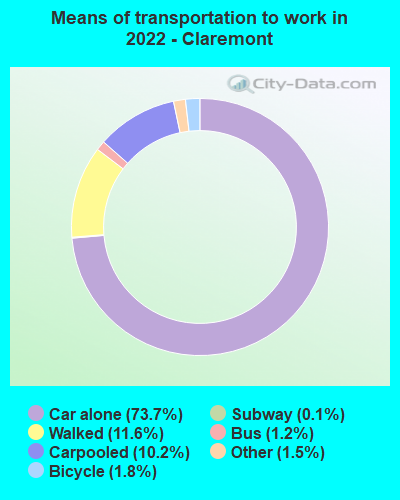
Means of transportation to work:
- Drove a car alone: 10,355 (56.1%)
- Carpooled: 1,580 (8.6%)
- Bus: 147 (0.8%)
- Long-distance train or commuter rail: 11 (0.1%)
- Taxi: 223 (1.2%)
- Bicycle: 258 (1.4%)
- Walked: 1,756 (9.5%)
- Worked at home: 4,708 (25.5%)

- Unemployment by race in 2022
- Unemployment rate for White non-Hispanic residents
- 6.1%Males
- 4.2%Females
- Unemployment rate for Black residents
- 5.8%Males
- 2.3%Females
- Unemployment rate for Asian residents
- 3.7%Males
- 5.0%Females
- Unemployment rate for other race residents
- 4.4%Males
- 2.5%Females
- Unemployment rate for two or more race residents
- 2.9%Males
- 6.1%Females
- Unemployment rate for Hispanic or Latino residents
- 3.0%Males
- 2.0%Females

- Year of entry for the foreign-born population in Claremont, California
- 1,5272010 or later
- 9552000 to 2009
- 1,1861990 to 1999
- 1,3481980 to 1989
- 9891970 to 1979
- 1,249Before 1970
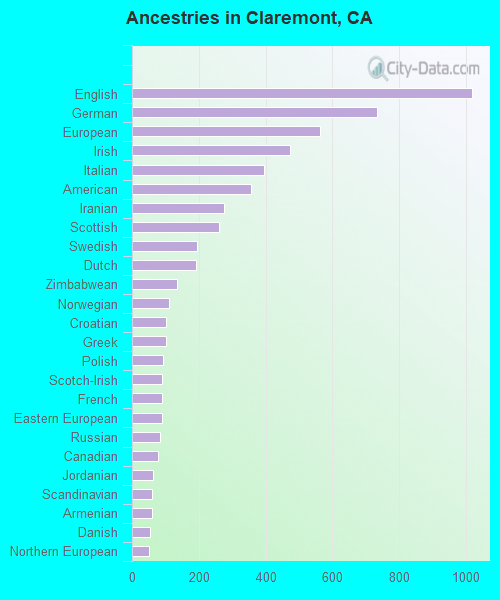
First ancestries reported:
- English: 1,018 (6.1%)
- German: 734 (4.4%)
- European: 563 (3.4%)
- Irish: 473 (2.8%)
- Italian: 396 (2.4%)
- American: 357 (2.1%)
- Iranian: 276 (1.6%)
- Scottish: 259 (1.5%)
- Swedish: 194 (1.2%)
- Dutch: 192 (1.1%)
- Zimbabwean: 134 (0.8%)
- Norwegian: 111 (0.7%)
- Croatian: 102 (0.6%)
- Greek: 101 (0.6%)
- Polish: 93 (0.6%)
- Scotch-Irish: 91 (0.5%)
- French: 91 (0.5%)
- Eastern European: 89 (0.5%)
- Russian: 85 (0.5%)
- Canadian: 77 (0.5%)
- Jordanian: 64 (0.4%)
- Scandinavian: 60 (0.4%)
- Armenian: 59 (0.4%)
- Danish: 54 (0.3%)
- Northern European: 50 (0.3%)
- British: 47 (0.3%)
- African: 44 (0.3%)
- Ethiopian: 42 (0.2%)
- Lebanese: 39 (0.2%)
- Slovak: 36 (0.2%)
- Basque: 36 (0.2%)
- Albanian: 33 (0.2%)
- Ghanaian: 31 (0.2%)
- Jamaican: 30 (0.2%)
- Hungarian: 29 (0.2%)
- Romanian: 21 (0.1%)
- Belgian: 19 (0.1%)
- Austrian: 16 (0.10%)
- Nigerian: 16 (0.10%)
- Welsh: 15 (0.09%)
- French Canadian: 14 (0.08%)
- Czech: 12 (0.07%)
- Portuguese: 11 (0.07%)
- Palestinian: 10 (0.06%)
- Egyptian: 9 (0.05%)
- Serbian: 8 (0.05%)
- Brazilian: 7 (0.04%)
- Guyanese: 6 (0.04%)
- Swiss: 5 (0.03%)
- Ukrainian: 5 (0.03%)
- Lithuanian: 3 (0.02%)
- British West Indian: 2 (0.01%)
- Yugoslavian: 2 (0.01%)
- Bulgarian: 1 (0.01%)
Most common places of birth for foreign-born residents (%):
| Claremont: | 17.3% (1,070) |
| California: | 6.6% (684,672) |
| Claremont: | 14.0% (867) |
| California: | 37.2% (3,881,193) |
| Claremont: | 8.3% (514) |
| California: | 7.8% (818,297) |
| Claremont: | 7.4% (456) |
| California: | 3.0% (315,248) |
| Claremont: | 5.9% (365) |
| California: | 4.9% (512,335) |
| Claremont: | 4.9% (303) |
| California: | 5.2% (539,184) |
| Claremont: | 4.8% (299) |
| California: | 1.7% (176,274) |
| Claremont: | 3.3% (206) |
| California: | 2.0% (206,004) |
| Claremont: | 2.7% (170) |
| California: | 1.2% (127,477) |
| Claremont: | 2.4% (150) |
| California: | 4.2% (440,287) |
| Claremont: | 1.6% (102) |
| California: | 0.6% (60,582) |
| Claremont: | 1.5% (93) |
| California: | 2.8% (290,436) |
Place of birth for U.S.-born residents:
- This state: 21,004
- Other state: 8,464
- Northeast: 2,291
- Midwest: 2,683
- South: 2,009
- West: 1,437
83.9% of Claremont residents lived in the same house 1 years ago.
Out of people who lived in different houses, 29.1% lived in this county.
Out of people who lived in different counties, 66.9% lived in California.
| Claremont: | 83.9% |
| State average: | 88.9% |
Education attainment for males 25 years and older:
- No schooling: 240
- Nursery to 4th grade: 0
- 5th and 6th grade: 64
- 7th and 8th grade: 68
- 9th grade: 5
- 10th grade: 60
- 11th grade: 66
- 12th grade, no diploma: 161
- High school graduate (or equivalency): 1,362
- Less than 1 year of college: 659
- Some college more than 1 year, no degree: 1,429
- Associate degree: 690
- Bachelor's degree: 3,141
- Master's degree: 1,728
- Professional school degree: 795
- Doctorate degree: 1,003

Education attainment for females 25 years and older:
- No schooling: 213
- Nursery to 4th grade: 66
- 5th and 6th grade: 140
- 7th and 8th grade: 18
- 9th grade: 19
- 10th grade: 126
- 11th grade: 20
- 12th grade, no diploma: 93
- High school graduate (or equivalency): 1,504
- Less than 1 year of college: 798
- Some college more than 1 year, no degree: 1,352
- Associate degree: 1,081
- Bachelor's degree: 3,734
- Master's degree: 2,826
- Professional school degree: 464
- Doctorate degree: 853


Housing units in structures:
- One, detached: 9,200
- One, attached: 1,370
- Two: 173
- 3 or 4: 459
- 5 to 9: 661
- 10 to 19: 268
- 20 to 49: 504
- 50 or more: 666
- Mobile homes: 22
Housing units lacking complete kitchen facilities in 2022: 2.7%
House/condo owner moved in on average 14 years ago
Renter moved in on average 3 years ago

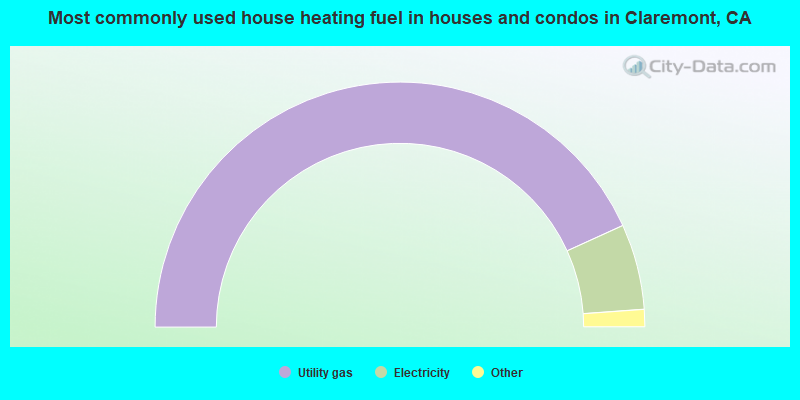
- 86.4%Utility gas
- 11.3%Electricity
- 0.8%Bottled, tank, or LP gas
- 0.7%No fuel used
- 0.6%Solar energy
- 0.1%Wood
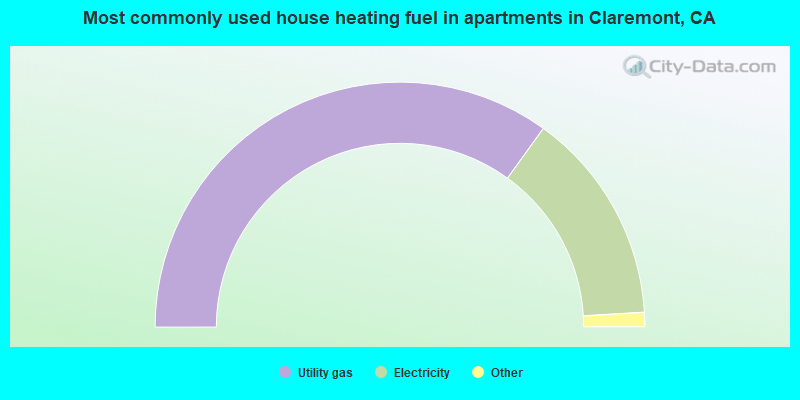
- 70.0%Utility gas
- 28.2%Electricity
- 1.1%Bottled, tank, or LP gas
- 0.7%No fuel used
- 0.1%Solar energy
Private vs. public school enrollment:
| Here: | 15.4% |
| California: | 10.5% |
| Here: | 12.9% |
| California: | 8.5% |
| Here: | 55.7% |
| California: | 15.9% |


