Wilmore: Fire Incidents, Kentucky (KY)
Where are fire incidents reported in Wilmore, KY
Something went wrong! Please refresh the page.
|
| |||||||||||||||||||||||||||||||||||||||||||||||||||||||||||||||||||||||||||||||||||||||||||||||||||||||||||||
2004 - 2018 National Fire Incident Reporting System (NFIRS) incidents
- Incident types reported to NFIRS in Wilmore, KY
- 19026.4%Rescue & EMS
- 17524.3%Fire
- 12617.5%False Alarm
- 11616.1%Hazardous Condition
- 638.8%Good Intent Call
- 425.8%Service Call
- 30.4%Overpressure Rupture
- 20.3%Severe Weather
- 20.3%Special Incident
- Fire incident types reported to NFIRS in Wilmore, KY
- 7744.0%Outside Fires
- 7542.9%Structure Fires
- 1810.3%Mobile Property/Vehicle Fires
- 52.9%Other
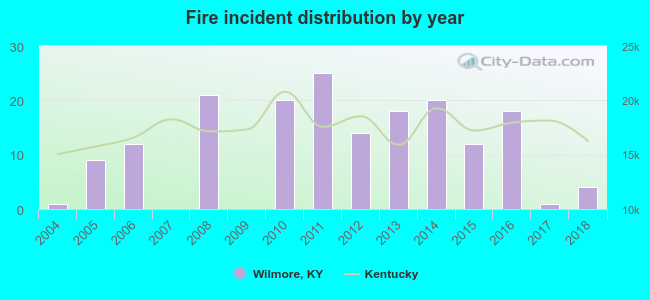 According to the data from the years 2004 - 2018 the average number of fire incidents per year is 12. The highest number of reported fire incidents - 25 took place in 2011, and the least - 0 in 2007. The data has a growing trend.
The average number of yearly fire incidents per 10k residents in Wilmore, KY compared to nearest cities:
(Note: Based on data for the last 3 years, including only cities with population 5,000 and above)
| Wilmore: | 12.5 |
| Nicholasville: | 62.1 |
| Harrodsburg: | 106.4 |
| Versailles: | 83.2 |
| Danville: | 54.6 |
| Lawrenceburg: | 40.6 |
| Richmond: | 89.8 |
| Georgetown: | 39.4 |
| Frankfort: | 53.7 |

 29.7% incidents where reported in the morning and 70.3% in the evening. The most fires (18.3%) took place on Friday, and the least (12.0%) on Monday.
 According to the 175 incident reports from years 2004 - 2018 most fires (12.6%) took place during March, and the least (5.1%) in December.
 Out of all 719 cases reported during the years 2004 - 2018, the most belonged to the categories: Rescue & EMS (26.4%), Fire (24.3%), and False Alarm (17.5%).
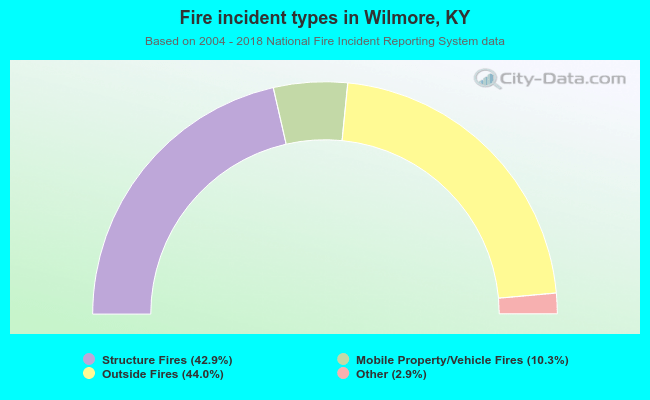 When looking into fire subcategories, the most incidents belonged to: Outside Fires (44.0%), and Structure Fires (42.9%).