Westford: Fire Incidents, Massachusetts (MA)
Where are fire incidents reported in Westford, MA
Something went wrong! Please refresh the page.
| Fire incidents reported | |
|---|---|
| Sreet name | Count |
| ROUTE 495 | 120 |
| LITTLETON RD | 108 |
| GROTON RD | 100 |
| POWERS RD | 58 |
| CONCORD RD | 52 |
| MAIN ST | 50 |
| WEST PRESCOTT ST | 28 |
| PLAIN RD | 26 |
| PLEASANT ST | 26 |
| WEST ST | 26 |
| BROOKSIDE RD | 24 |
| DEPOT ST | 24 |
| TOWN FARM RD | 24 |
| VINEYARD RD | 24 |
| CARLISLE RD | 20 |
| TADMUCK RD | 20 |
| OAK HILL RD | 18 |
| TENNEY RD | 18 |
| BOSTON RD | 16 |
| KEYES RD | 16 |
| LAN DR | 16 |
| NORTH MAIN ST | 16 |
| GRANITEVILLE RD | 14 |
| RUSSELL'S WAY | 14 |
| BEAVER BROOK RD | 12 |
| CHAMBERLAIN RD | 12 |
| COLD SPRING RD | 12 |
| DUNSTABLE RD | 12 |
| MILOT RD | 12 |
| MYRTLE AVE | 12 |
2002 - 2018 National Fire Incident Reporting System (NFIRS) incidents
- Incident types reported to NFIRS in Westford, MA
- 6,29452.0%Rescue & EMS
- 2,06717.1%False Alarm
- 1,23310.2%Service Call
- 1,1919.8%Hazardous Condition
- 8717.2%Fire
- 3853.2%Good Intent Call
- 600.5%Special Incident
- Fire incident types reported to NFIRS in Westford, MA
- 32937.8%Outside Fires
- 30835.4%Structure Fires
- 12914.8%Other
- 10512.1%Mobile Property/Vehicle Fires
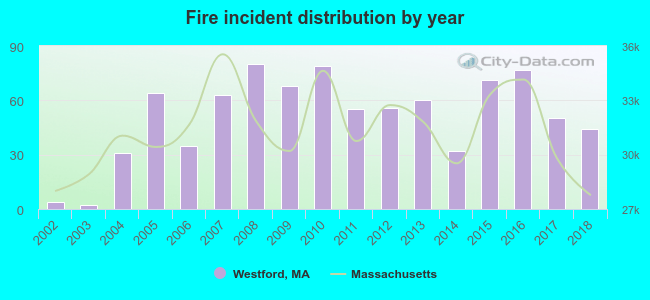 According to the data from the years 2002 - 2018 the average number of fire incidents per year is 51. The highest number of reported fires - 80 took place in 2008, and the least - 2 in 2003. The data has a rising trend.
The average number of yearly fire incidents per 10k residents in Westford, MA compared to nearest cities:
(Note: Based on data for the last 3 years, including only cities with population 5,000 and above)
| Westford: | 26.0 |
| Chelmsford: | 12.3 |
| Littleton: | 35.5 |
| Tyngsborough: | 24.5 |
| Lowell: | 41.4 |
| Acton: | 24.9 |
| Dracut: | 20.3 |
| Billerica: | 27.3 |
| Harvard: | 36.3 |
 The median response time based on all reported fire incidents is 6 minutes. This is higher than the state median value.
The median response time in Westford, MA compared to nearest cities:
(Note: Based on data for all years, including only cities with at least 500 fire incidents)
| Westford: | 6 minutes |
| Chelmsford: | 5 minutes |
| Littleton: | 6 minutes |
| Lowell: | 3 minutes |
| Ayer: | 4 minutes |
| Acton: | 4 minutes |
| Dracut: | 5 minutes |
| Pepperell: | 4 minutes |
| Billerica: | 4 minutes |
 According to the data from the years 2002 - 2018 the average number of fire-related yearly casualties is 1. The highest number of reported injuries - 2 took place in 2009, and the lowest - 0 in 2002. The data has an increasing trend.
The average number of casualties per 1,000 fires is 10. This indicator was the highest - 45 in 2018, and the lowest 0 in 2002. The trend for injuries per 1,000 incidents is growing. Compared to the Massachusetts value the number of casualties per 1,000 fire incidents is similar.
According to the data from the years 2002 - 2018 the average number of fire-related yearly casualties is 1. The highest number of reported injuries - 2 took place in 2009, and the lowest - 0 in 2002. The data has an increasing trend.
The average number of casualties per 1,000 fires is 10. This indicator was the highest - 45 in 2018, and the lowest 0 in 2002. The trend for injuries per 1,000 incidents is growing. Compared to the Massachusetts value the number of casualties per 1,000 fire incidents is similar.
 29.5% incidents where reported in the morning and 70.5% in the evening. The most fires (15.4%) took place on Friday, and the least (12.9%) on Thursday.
 According to the 871 reports from years 2002 - 2018 most fires (14.8%) took place during April, and the least (4.6%) in October.
 Out of all 12,112 cases reported during the years 2002 - 2018, the most belonged to the categories: Rescue & EMS (52.0%), False Alarm (17.1%), and Service Call (10.2%).
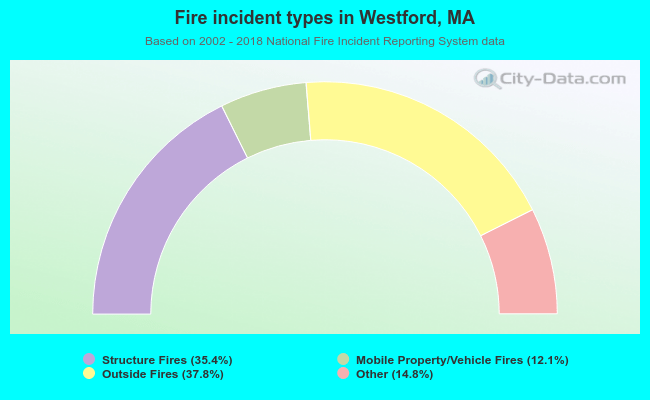 When looking into fire subcategories, the most incidents belonged to: Outside Fires (37.8%), and Structure Fires (35.4%).