Watertown: Fire Incidents, Massachusetts (MA)
Where are fire incidents reported in Watertown, MA
Something went wrong! Please refresh the page.
| Fire incidents reported | |
|---|---|
| Sreet name | Count |
| ARSENAL ST | 146 |
| MT AUBURN ST | 102 |
| MAIN ST | 80 |
| PLEASANT ST | 70 |
| ARSENAL ST | 64 |
| MAIN ST | 40 |
| MT AUBURN ST | 40 |
| PLEASANT ST | 40 |
| GROVE ST | 34 |
| COOLIDGE AVE | 28 |
| BELMONT ST | 24 |
| BIGELOW AVE | 24 |
| GALEN ST | 24 |
| WALNUT ST | 24 |
| WATERTOWN ST | 24 |
| BELMONT ST | 22 |
| GROVE ST | 22 |
| NORTH BEACON ST | 22 |
| ARLINGTON ST | 18 |
| DEXTER AV | 18 |
| LEXINGTON ST | 18 |
| SPRING ST | 18 |
| WHITES AV | 18 |
| GALEN ST | 16 |
| QUIMBY ST | 16 |
| ARLINGTON ST | 14 |
| BIGELOW AV | 14 |
| BRIDGE ST | 14 |
| OLCOTT ST | 14 |
| WAVERLEY AV | 14 |
| Other | 207 |
2002 - 2018 National Fire Incident Reporting System (NFIRS) incidents
- Incident types reported to NFIRS in Watertown, MA
- 17,31254.2%Rescue & EMS
- 4,24813.3%Hazardous Condition
- 4,09612.8%Service Call
- 3,98412.5%False Alarm
- 1,2293.8%Fire
- 8892.8%Good Intent Call
- 1380.4%Special Incident
- 470.1%Severe Weather
- Fire incident types reported to NFIRS in Watertown, MA
- 62150.5%Structure Fires
- 30624.9%Outside Fires
- 19716.0%Other
- 1058.5%Mobile Property/Vehicle Fires
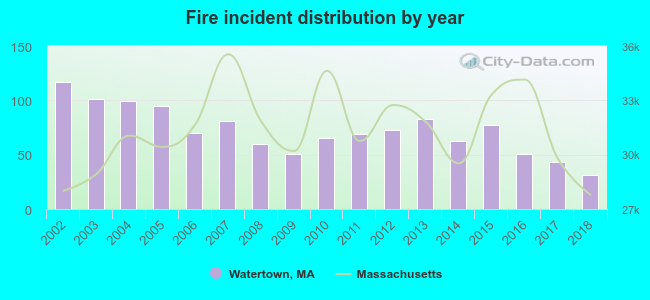 According to the data from the years 2002 - 2018 the average number of fire incidents per year is 72. The highest number of reported fire incidents - 117 took place in 2002, and the least - 31 in 2018. The data has a declining trend.
The average number of yearly fire incidents per 10k residents in Watertown, MA compared to nearest cities:
(Note: Based on data for the last 3 years, including only cities with population 5,000 and above)
| Watertown: | 12.2 |
| Belmont: | 42.3 |
| Newton: | 29.6 |
| Waltham: | 31.2 |
| Arlington: | 23.8 |
| Cambridge: | 99.2 |
| Brookline: | 72.0 |
| Somerville: | 56.2 |
| Medford: | 41.3 |
 The median response time based on all reported fire incidents is 4 minutes. This is comparable to the state median value.
The median response time in Watertown, MA compared to nearest cities:
(Note: Based on data for all years, including only cities with at least 500 fire incidents)
| Watertown: | 4 minutes |
| Belmont: | 4 minutes |
| Newton: | 5 minutes |
| Waltham: | 4 minutes |
| Arlington: | 3 minutes |
| Cambridge: | 5 minutes |
| Brookline: | 3 minutes |
| Somerville: | 3 minutes |
| Medford: | 3 minutes |
 According to the reports from the years 2002 - 2018 the average number of fire-related casualties per year is 1. The highest number of reported injuries - 4 took place in 2008, and the lowest - 0 in 2002. The data has a constant trend.
The average number of injuries per 1,000 fires is 14. This indicator was the highest - 67 in 2008, and the lowest 0 in 2002. The trend for injuries per 1,000 fires is dropping. Compared to the state value the number of injuries per 1,000 fire incidents is similar.
According to the reports from the years 2002 - 2018 the average number of fire-related casualties per year is 1. The highest number of reported injuries - 4 took place in 2008, and the lowest - 0 in 2002. The data has a constant trend.
The average number of injuries per 1,000 fires is 14. This indicator was the highest - 67 in 2008, and the lowest 0 in 2002. The trend for injuries per 1,000 fires is dropping. Compared to the state value the number of injuries per 1,000 fire incidents is similar.
 28.6% incidents where reported in the morning and 71.4% in the evening. The most fires (15.9%) took place on Sunday, and the least (13.0%) on Thursday.
 Based on the 1,229 fire incidents from years 2002 - 2018 most fires (11.6%) took place during May, and the least (5.6%) in December.
 Out of all 31,964 cases reported during the years 2002 - 2018, the most belonged to the categories: Rescue & EMS (54.2%), Hazardous Condition (13.3%), and Service Call (12.8%).
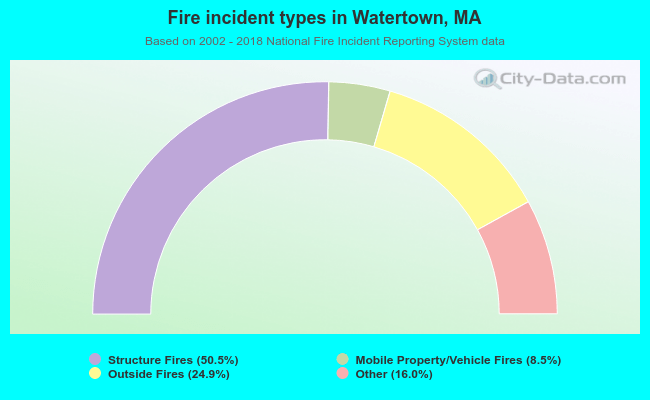 When looking into fire subcategories, the most reports belonged to: Structure Fires (50.5%), and Outside Fires (24.9%).