Superior: Fire Incidents, Wisconsin (WI)
Where are fire incidents reported in Superior, WI
Something went wrong! Please refresh the page.
| Fire incidents reported | |
|---|---|
| Sreet name | Count |
| TOWER AV | 180 |
| HAMMOND AV | 100 |
| OGDEN AV | 94 |
| JOHN AV | 92 |
| HUGHITT AV | 78 |
| WINTER ST | 78 |
| BELKNAP ST | 76 |
| CATLIN AV | 70 |
| BANKS AV | 62 |
| E 2ND ST | 58 |
| OAKES AV | 56 |
| E 4TH ST | 46 |
| N 21ST ST | 46 |
| CENTRAL AV | 44 |
| CUMMING AV | 42 |
| E 3RD ST | 42 |
| N 12TH ST | 42 |
| E 5TH ST | 40 |
| WEEKS AV | 34 |
| BAXTER AV | 32 |
| E 1ST ST | 32 |
| E 6TH ST | 32 |
| MOCCASIN MIKE RD | 32 |
| N 28TH ST | 32 |
| NEW YORK AV | 32 |
| HILL AV | 28 |
| BILLINGS DR | 26 |
| BROADWAY ST | 26 |
| GRAND AV | 26 |
| IOWA AV | 26 |
| Other | 119 |
2002 - 2018 National Fire Incident Reporting System (NFIRS) incidents
- Incident types reported to NFIRS in Superior, WI
- 4,48139.7%Rescue & EMS
- 1,72315.3%Fire
- 1,57714.0%Hazardous Condition
- 1,29611.5%False Alarm
- 9988.8%Good Intent Call
- 9598.5%Service Call
- 2121.9%Special Incident
- 390.3%Overpressure Rupture
- Fire incident types reported to NFIRS in Superior, WI
- 69740.5%Outside Fires
- 62436.2%Structure Fires
- 25714.9%Mobile Property/Vehicle Fires
- 1458.4%Other
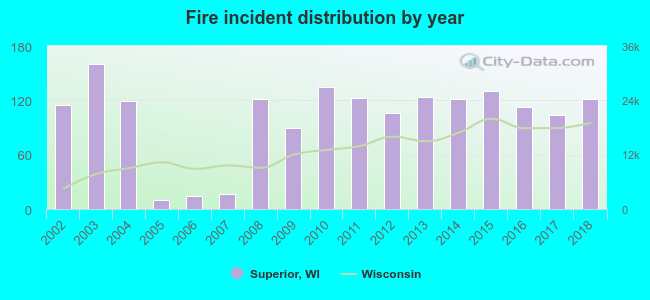 According to the data from the years 2002 - 2018 the average number of fire incidents per year is 101. The highest number of fire incidents - 160 took place in 2003, and the least - 10 in 2005. The data has a rising trend.
The average number of yearly fire incidents per 10k residents in Superior, WI compared to nearest cities:
(Note: Based on data for the last 3 years, including only cities with population 5,000 and above)
| Superior: | 42.2 |
 The median response time based on all reported fire incidents is 4 minutes. This is lower compared to the Wisconsin median value.
The median response time in Superior, WI compared to nearest cities:
(Note: Based on data for all years, including only cities with at least 500 fire incidents)
| Superior: | 4 minutes |
| Duluth: | 5 minutes |
| Hermantown: | 7 minutes |
| Cloquet: | 5 minutes |
 Based on the reports from the years 2002 - 2018 the average number of fire-related fatalities per year is 0. The highest number of deaths - 2 took place in 2014, and the lowest - 0 in 2003. The data has a declining trend.
 Based on the reports from the years 2002 - 2018 the average number of fire-related yearly casualties is 1. The highest number of reported injuries - 4 took place in 2002, and the lowest - 0 in 2005. The data has a decreasing trend.
The average number of injuries per 1,000 fire incidents is 8. This indicator was the highest - 35 in 2002, and the lowest 0 in 2005. The trend for casualties per 1,000 incidents is decreasing. Compared to the state value the number of injuries per 1,000 fires is about the same.
Based on the reports from the years 2002 - 2018 the average number of fire-related yearly casualties is 1. The highest number of reported injuries - 4 took place in 2002, and the lowest - 0 in 2005. The data has a decreasing trend.
The average number of injuries per 1,000 fire incidents is 8. This indicator was the highest - 35 in 2002, and the lowest 0 in 2005. The trend for casualties per 1,000 incidents is decreasing. Compared to the state value the number of injuries per 1,000 fires is about the same.Casualties per 1,000 incidents in Superior, WI compared to nearest cities:
(Note: Based on data for all years, including only cities with at least 500 fire incidents)
| Superior: | 9.3 |
| Duluth: | 15.5 |
| Hermantown: | 5.3 |
| Cloquet: | 23.9 |
 35.3% incidents where reported in the morning and 64.7% in the evening. The most fires (15.4%) took place on Monday, and the least (12.8%) on Thursday.
 According to the 1,723 fire incident reports from years 2002 - 2018 most fires (11.5%) took place during April, and the least (5.2%) in December.
 Out of all 11,291 cases reported during the years 2002 - 2018, the most belonged to the categories: Rescue & EMS (39.7%), Fire (15.3%), and Hazardous Condition (14.0%).
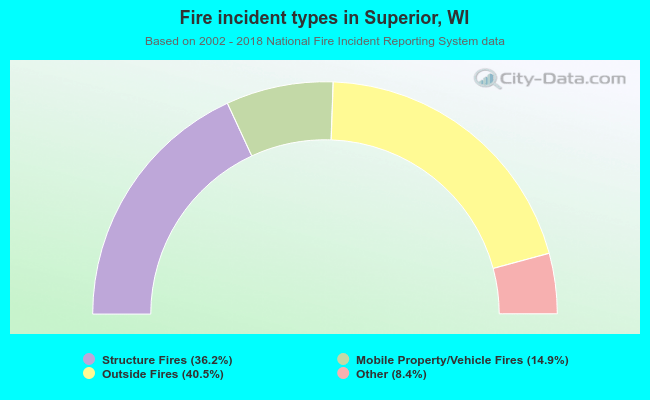 When looking into fire subcategories, the most reports belonged to: Outside Fires (40.5%), and Structure Fires (36.2%).