Stillwater: Fire Incidents, Oklahoma (OK)
Where are fire incidents reported in Stillwater, OK
Something went wrong! Please refresh the page.
| Fire incidents reported | |
|---|---|
| Sreet name | Count |
| 6TH AVE | 98 |
| PERKINS RD | 96 |
| PERKINS | 74 |
| FAIRGROUNDS RD | 72 |
| 44TH AVE | 62 |
| HUSBAND ST | 60 |
| MCELROY | 60 |
| MCELROY RD | 54 |
| WASHINGTON | 54 |
| COUNTRY CLUB RD | 52 |
| MAIN ST | 50 |
| JARDOT RD | 48 |
| 6TH | 46 |
| RANGE RD | 46 |
| HWY 51 | 42 |
| WASHINGTON ST | 40 |
| BOOMER RD | 38 |
| LAKEVIEW | 38 |
| WESTERN RD | 38 |
| 6TH ST | 36 |
| 56TH ST | 34 |
| HUSBAND | 34 |
| PERKINS RD | 34 |
| MCMURTRY RD | 32 |
| SANGRE RD | 32 |
| 44TH ST | 30 |
| AIRPORT RD | 30 |
| 68TH ST | 28 |
| BRUSH CREEK RD | 28 |
| DUCK ST | 28 |
| Other | 843 |
2002 - 2018 National Fire Incident Reporting System (NFIRS) incidents
- Incident types reported to NFIRS in Stillwater, OK
- 3,65628.4%Good Intent Call
- 3,27325.5%Rescue & EMS
- 2,25717.6%Fire
- 2,24217.4%False Alarm
- 9147.1%Hazardous Condition
- 4513.5%Service Call
- 300.2%Special Incident
- 220.2%Overpressure Rupture
- Fire incident types reported to NFIRS in Stillwater, OK
- 1,43463.5%Outside Fires
- 41718.5%Structure Fires
- 25011.1%Mobile Property/Vehicle Fires
- 1566.9%Other
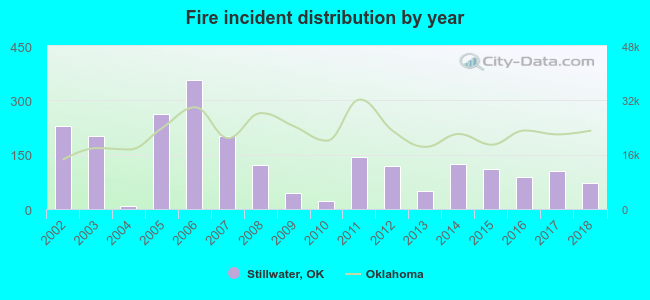 According to the data from the years 2002 - 2018 the average number of fire incidents per year is 133. The highest number of reported fires - 356 took place in 2006, and the least - 8 in 2004. The data has a declining trend.
The average number of yearly fire incidents per 10k residents in Stillwater, OK compared to nearest cities:
(Note: Based on data for the last 3 years, including only cities with population 5,000 and above)
| Stillwater: | 18.3 |
| Perry: | 113.0 |
| Cushing: | 80.1 |
| Guthrie: | 219.0 |
| Edmond: | 49.5 |
| Ponca City: | 66.2 |
 The median response time based on all reported fire incidents is 8 minutes. This is higher than the Oklahoma median value.
The median response time in Stillwater, OK compared to nearest cities:
(Note: Based on data for all years, including only cities with at least 500 fire incidents)
| Stillwater: | 8 minutes |
| Perkins: | 6 minutes |
| Perry: | 8 minutes |
| Cushing: | 7 minutes |
| Guthrie: | 8 minutes |
| Drumright: | 7 minutes |
| Wellston: | 10 minutes |
| Chandler: | 9 minutes |
| Luther: | 10 minutes |
 Based on the data from the years 2002 - 2018 the average number of fire-related yearly deaths is 0. The highest number of reported deaths - 2 took place in 2002, and the lowest - 0 in 2003. The data has a declining trend.
 26.2% incidents where reported in the morning and 73.8% in the evening. The most fires (17.0%) took place on Saturday, and the least (11.8%) on Monday.
 Based on the 2,257 incident reports from years 2002 - 2018 most fires (14.3%) took place during March, and the least (5.0%) in June.
 Out of all 12,854 cases reported during the years 2002 - 2018, the most belonged to the categories: Good Intent Call (28.4%), Rescue & EMS (25.5%), and Fire (17.6%).
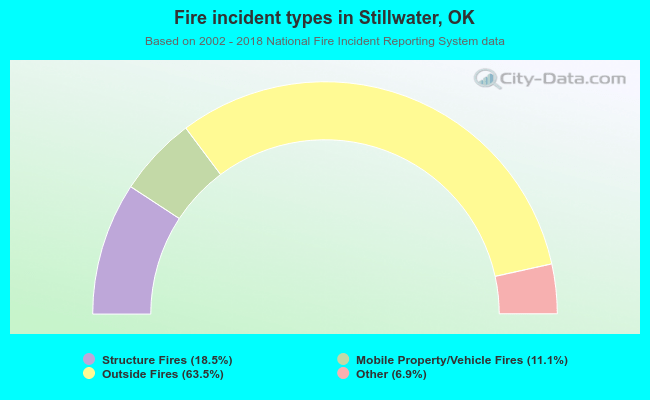 When looking into fire subcategories, the most reports belonged to: Outside Fires (63.5%), and Structure Fires (18.5%).