Somerset: Fire Incidents, Kentucky (KY)
Where are fire incidents reported in Somerset, KY
Something went wrong! Please refresh the page.
| Fire incidents reported | |
|---|---|
| Sreet name | Count |
| HWY 27 | 148 |
| 27 HWY | 80 |
| MAIN ST | 62 |
| HIGHWAY 27 | 56 |
| 27 HIGH | 54 |
| HWY 80 | 54 |
| 80 HWY | 38 |
| RINGGOLD RD | 32 |
| BOAT DOCK RD | 30 |
| MT VERNON ST | 30 |
| OAK HILL RD | 30 |
| HILL RD | 28 |
| ROCK QUARRY RD | 28 |
| SLATE BRANCH RD | 28 |
| HIGHWAY 39 | 24 |
| 1247 HWY | 22 |
| COLLEGE ST | 22 |
| HWY 2227 | 22 |
| MONTICELLO ST | 22 |
| 80 HIGH | 20 |
| HWY 192 | 18 |
| RUSH BRANCH RD | 18 |
| 914 HWY | 16 |
| ARTHUR DR | 16 |
| CAMPGROUND RD | 16 |
| LANGDON ST | 16 |
| WASHINGTON DR | 16 |
| 1643 HWY | 14 |
| 3057 HWY | 14 |
| CLIFTY ST | 14 |
| Other | 2,109 |
2002 - 2018 National Fire Incident Reporting System (NFIRS) incidents
- Incident types reported to NFIRS in Somerset, KY
- 3,09730.5%Fire
- 2,49824.6%Rescue & EMS
- 1,70416.8%Good Intent Call
- 1,03110.2%False Alarm
- 1,0099.9%Hazardous Condition
- 7457.3%Service Call
- 300.3%Special Incident
- 240.2%Overpressure Rupture
- 110.1%Severe Weather
- Fire incident types reported to NFIRS in Somerset, KY
- 1,26340.8%Structure Fires
- 1,11536.0%Outside Fires
- 51616.7%Mobile Property/Vehicle Fires
- 2036.6%Other
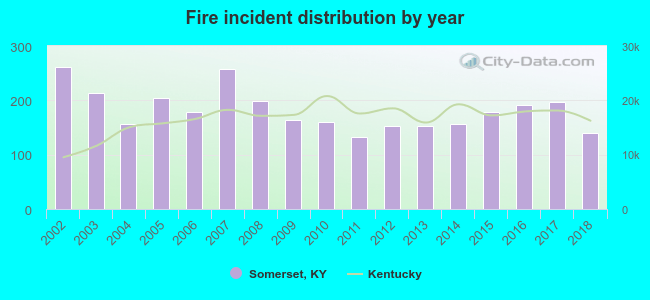 According to the data from the years 2002 - 2018 the average number of fire incidents per year is 182. The highest number of fires - 261 took place in 2002, and the least - 133 in 2011. The data has a decreasing trend.
The average number of yearly fire incidents per 10k residents in Somerset, KY compared to nearest cities:
(Note: Based on data for the last 3 years, including only cities with population 5,000 and above)
| Somerset: | 154.4 |
| Nancy: | 32.2 |
| Waynesburg: | 64.9 |
| Monticello: | 171.7 |
| Keavy: | 3.3 |
| London: | 195.7 |
| Corbin: | 151.9 |
| Williamsburg: | 231.3 |
| Berea: | 36.2 |
 The median response time based on all reported fire incidents is 7 minutes. This is about the same as the Kentucky median value.
The median response time in Somerset, KY compared to nearest cities:
(Note: Based on data for all years, including only cities with at least 500 fire incidents)
| Somerset: | 7 minutes |
| Science Hill: | 9 minutes |
| Eubank: | 10 minutes |
| Monticello: | 10 minutes |
| Liberty: | 9 minutes |
| Brodhead: | 9 minutes |
| Russell Springs: | 8 minutes |
| East Bernstadt: | 10 minutes |
| London: | 8 minutes |
 According to the reports from the years 2002 - 2018 the average number of fire-related yearly deaths is 0. The highest number of reported deaths - 2 took place in 2013, and the lowest - 0 in 2002. The data has a growing trend.
The average number of fatalities per 1,000 fire incidents is 3. This indicator was the highest - 14 in 2018, and the lowest 0 in 2002. The trend for deaths per 1,000 fires is rising. Compared to the Kentucky value the number of fatalities per 1,000 fires is similar.
According to the reports from the years 2002 - 2018 the average number of fire-related yearly deaths is 0. The highest number of reported deaths - 2 took place in 2013, and the lowest - 0 in 2002. The data has a growing trend.
The average number of fatalities per 1,000 fire incidents is 3. This indicator was the highest - 14 in 2018, and the lowest 0 in 2002. The trend for deaths per 1,000 fires is rising. Compared to the Kentucky value the number of fatalities per 1,000 fires is similar.
 32.5% incidents where reported in the morning and 67.5% in the evening. The most fires (16.2%) took place on Saturday, and the least (12.5%) on Wednesday.
 Based on the 3,097 fires from years 2002 - 2018 most fires (11.7%) took place during March, and the least (6.6%) in December.
 Out of all 10,149 cases reported during the years 2002 - 2018, the most belonged to the categories: Fire (30.5%), Rescue & EMS (24.6%), and Good Intent Call (16.8%).
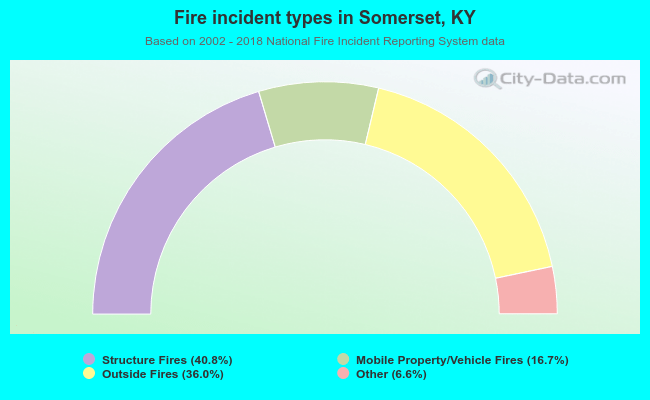 When looking into fire subcategories, the most incidents belonged to: Structure Fires (40.8%), and Outside Fires (36.0%).