Seaside: Fire Incidents, Oregon (OR)
Where are fire incidents reported in Seaside, OR
Something went wrong! Please refresh the page.
|
| |||||||||||||||||||||||||||||||||||||||||||||||||||||||||||||||||||||||||||||||||||||||||||||||||||||||||||||
2002 - 2018 National Fire Incident Reporting System (NFIRS) incidents
- Incident types reported to NFIRS in Seaside, OR
- 1,97351.2%Rescue & EMS
- 78820.5%Fire
- 47412.3%Hazardous Condition
- 2757.1%False Alarm
- 2235.8%Service Call
- 862.2%Good Intent Call
- 190.5%Severe Weather
- 110.3%Special Incident
- Fire incident types reported to NFIRS in Seaside, OR
- 37047.0%Structure Fires
- 33041.9%Outside Fires
- 698.8%Mobile Property/Vehicle Fires
- 192.4%Other
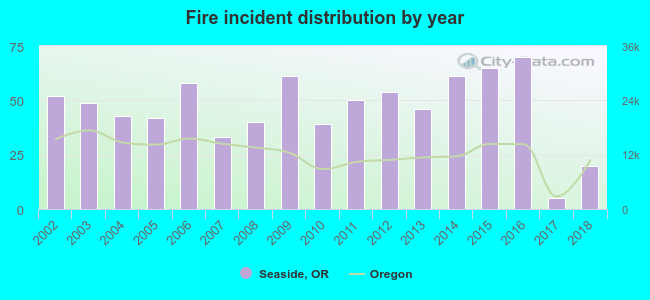 According to the data from the years 2002 - 2018 the average number of fires per year is 46. The highest number of reported fire incidents - 70 took place in 2016, and the least - 5 in 2017. The data has a dropping trend.
The average number of yearly fire incidents per 10k residents in Seaside, OR compared to nearest cities:
(Note: Based on data for the last 3 years, including only cities with population 5,000 and above)
| Seaside: | 48.8 |
| Warrenton: | 48.3 |
| Astoria: | 62.7 |
| Forest Grove: | 29.4 |
| Scappoose: | 55.4 |
| Cornelius: | 24.1 |
 The median response time based on all reported fire incidents is 8 minutes. This is higher than the Oregon median value.
The median response time in Seaside, OR compared to nearest cities:
(Note: Based on data for all years, including only cities with at least 500 fire incidents)
| Seaside: | 8 minutes |
| Astoria: | 6 minutes |
| Tillamook: | 5 minutes |
| Banks: | 12 minutes |
| Forest Grove: | 8 minutes |
| Scappoose: | 8 minutes |
| Cornelius: | 8 minutes |
| Gaston: | 13 minutes |
 32.7% incidents where reported in the morning and 67.3% in the evening. The most fires (16.9%) took place on Tuesday, and the least (11.0%) on Friday.
 Based on the 788 fire incidents from years 2002 - 2018 most fires (17.9%) took place during July, and the least (3.2%) in November.
 Out of all 3,852 cases reported during the years 2002 - 2018, the most belonged to the categories: Rescue & EMS (51.2%), Fire (20.5%), and Hazardous Condition (12.3%).
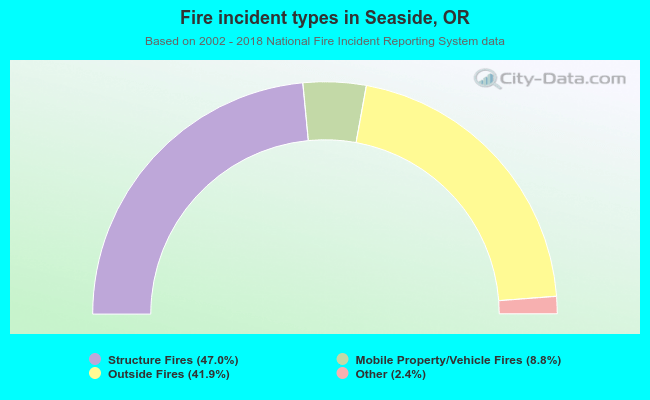 When looking into fire subcategories, the most incidents belonged to: Structure Fires (47.0%), and Outside Fires (41.9%).