Romeoville: Fire Incidents, Illinois (IL)
Where are fire incidents reported in Romeoville, IL
Something went wrong! Please refresh the page.
| Fire incidents reported | |
|---|---|
| Sreet name | Count |
| WEBER RD | 240 |
| INDEPENDENCE BLVD | 150 |
| ROMEO RD | 88 |
| HIGHPOINT DR | 86 |
| NORMANTOWN RD | 78 |
| WEBER | 60 |
| MONTROSE DR | 48 |
| MURPHY DR | 46 |
| BELMONT DR | 38 |
| TAYLOR RD | 38 |
| FORESTWOOD DR | 36 |
| LAKEVIEW DR | 36 |
| AIRPORT RD | 30 |
| YARROW CT | 30 |
| PARKWOOD | 24 |
| BUDLER RD | 20 |
| MARQUETTE DR | 20 |
| SANTA FE RD | 20 |
| EDWARD DR | 18 |
| JOLIET RD | 18 |
| SIERRA TRL | 18 |
| SUPERIOR DR | 18 |
| CROSSROADS | 16 |
| GAVIN AVE | 16 |
| INDEPENDENCE | 16 |
| PARKWOOD AVE | 16 |
| BLUFF RD | 14 |
| FAIR MEADOWS DR | 14 |
| HALLER AVE | 14 |
| KAREN AVE | 14 |
| Other | 192 |
2002 - 2018 National Fire Incident Reporting System (NFIRS) incidents
- Incident types reported to NFIRS in Romeoville, IL
- 12,69650.3%Rescue & EMS
- 4,44417.6%False Alarm
- 3,13412.4%Service Call
- 1,9097.6%Hazardous Condition
- 1,5376.1%Good Intent Call
- 1,4725.8%Fire
- Fire incident types reported to NFIRS in Romeoville, IL
- 63443.1%Structure Fires
- 59240.2%Outside Fires
- 20714.1%Mobile Property/Vehicle Fires
- 392.6%Other
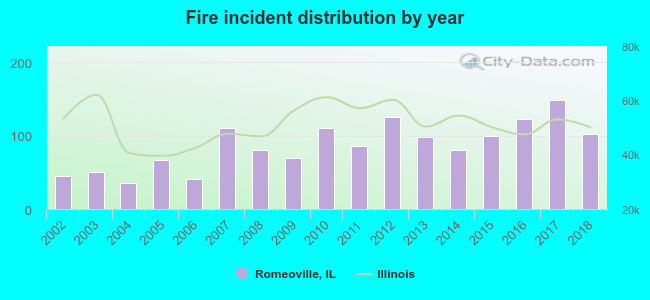 Based on the data from the years 2002 - 2018 the average number of fires per year is 87. The highest number of reported fire incidents - 148 took place in 2017, and the least - 35 in 2004. The data has an increasing trend.
The average number of yearly fire incidents per 10k residents in Romeoville, IL compared to nearest cities:
(Note: Based on data for the last 3 years, including only cities with population 5,000 and above)
| Romeoville: | 31.3 |
| Bolingbrook: | 23.8 |
| Lockport: | 43.1 |
| Crest Hill: | 23.6 |
| Plainfield: | 40.4 |
| Lemont: | 40.6 |
| Joliet: | 28.1 |
| Woodridge: | 20.6 |
| Naperville: | 16.1 |
 The median response time based on all reported fire incidents is 5 minutes. This is about the same as the Illinois median value.
The median response time in Romeoville, IL compared to nearest cities:
(Note: Based on data for all years, including only cities with at least 500 fire incidents)
| Romeoville: | 5 minutes |
| Bolingbrook: | 5 minutes |
| Lockport: | 5 minutes |
| Crest Hill: | 5 minutes |
| Plainfield: | 6 minutes |
| Lemont: | 7 minutes |
| Joliet: | 5 minutes |
| Woodridge: | 5 minutes |
| Naperville: | 5 minutes |
 Based on the reports from the years 2002 - 2018 the average number of fire-related yearly casualties is 1. The highest number of reported casualties - 5 took place in 2016, and the lowest - 0 in 2002. The data has a constant trend.
The average number of injuries per 1,000 fire incidents is 13. This indicator was the highest - 60 in 2005, and the lowest 0 in 2002. The trend for casualties per 1,000 fire incidents is constant. Compared to the Illinois value the number of injuries per 1,000 incidents is similar.
Based on the reports from the years 2002 - 2018 the average number of fire-related yearly casualties is 1. The highest number of reported casualties - 5 took place in 2016, and the lowest - 0 in 2002. The data has a constant trend.
The average number of injuries per 1,000 fire incidents is 13. This indicator was the highest - 60 in 2005, and the lowest 0 in 2002. The trend for casualties per 1,000 fire incidents is constant. Compared to the Illinois value the number of injuries per 1,000 incidents is similar.Casualties per 1,000 incidents in Romeoville, IL compared to nearest cities:
(Note: Based on data for all years, including only cities with at least 500 fire incidents)
| Romeoville: | 12.2 |
| Bolingbrook: | 20.8 |
| Lockport: | 16.0 |
| Crest Hill: | 11.5 |
| Plainfield: | 8.0 |
| Lemont: | 8.4 |
| Joliet: | 4.2 |
| Woodridge: | 19.9 |
| Naperville: | 23.5 |
 31.1% incidents where reported in the morning and 68.9% in the evening. The most fires (15.6%) took place on Sunday, and the least (12.7%) on Thursday.
 Based on the 1,472 fires from years 2002 - 2018 most fires (12.4%) took place during June, and the least (5.4%) in February.
 Out of all 25,219 cases reported during the years 2002 - 2018, the most belonged to the categories: Rescue & EMS (50.3%), False Alarm (17.6%), and Service Call (12.4%).
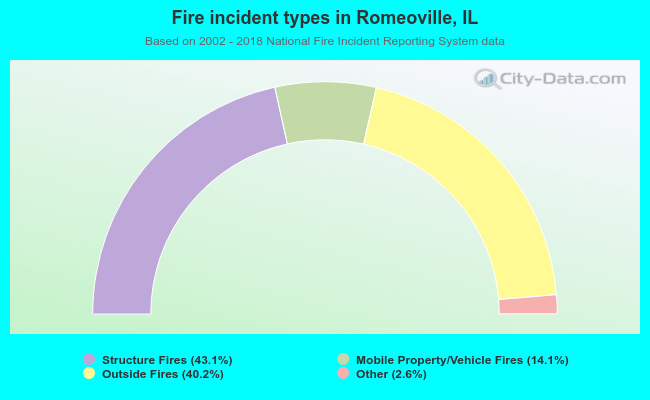 When looking into fire subcategories, the most reports belonged to: Structure Fires (43.1%), and Outside Fires (40.2%).