Richardson: Fire Incidents, Texas (TX)
Where are fire incidents reported in Richardson, TX
Something went wrong! Please refresh the page.
| Fire incidents reported | |
|---|---|
| Sreet name | Count |
| SPRING VALLEY RD | 234 |
| RENNER RD | 226 |
| CAMPBELL RD | 208 |
| ARAPAHO RD | 206 |
| CENTRAL EXPY | 200 |
| CENTRAL | 180 |
| BELT LINE RD | 176 |
| COIT RD | 176 |
| PLANO RD | 170 |
| CENTRAL EXPY | 168 |
| BUCKINGHAM RD | 128 |
| GREENVILLE AVE | 126 |
| ABRAMS RD | 102 |
| PGB HWY | 100 |
| COLLINS BLVD | 84 |
| WATERVIEW PKWY | 78 |
| BOWSER RD | 74 |
| LOOKOUT DR | 72 |
| CUSTER RD | 68 |
| GLENVILLE DR | 68 |
| EAST FRONTAGE RD | 64 |
| FLOYD RD | 64 |
| PGB | 58 |
| FRANCES WAY | 54 |
| MELROSE DR | 52 |
| CENTENNIAL BLVD | 50 |
| JUPITER RD | 50 |
| APOLLO RD | 48 |
| PRESTONWOOD DR | 48 |
| WEATHERRED DR | 44 |
| Other | 554 |
2002 - 2018 National Fire Incident Reporting System (NFIRS) incidents
- Incident types reported to NFIRS in Richardson, TX
- 42,04762.3%Rescue & EMS
- 8,53912.6%Hazardous Condition
- 6,0078.9%False Alarm
- 4,2956.4%Service Call
- 3,9305.8%Fire
- 2,5483.8%Good Intent Call
- 1010.1%Overpressure Rupture
- Fire incident types reported to NFIRS in Richardson, TX
- 1,52638.8%Outside Fires
- 1,28032.6%Structure Fires
- 88122.4%Mobile Property/Vehicle Fires
- 2436.2%Other
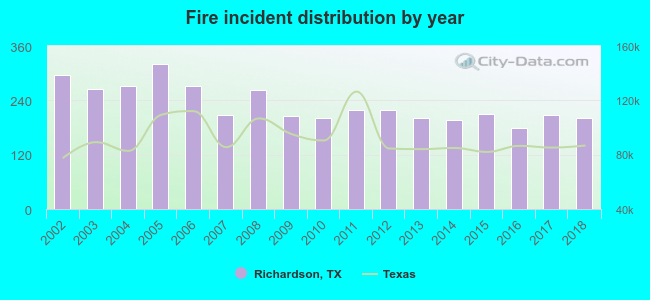 Based on the data from the years 2002 - 2018 the average number of fire incidents per year is 231. The highest number of reported fire incidents - 320 took place in 2005, and the least - 178 in 2016. The data has a declining trend.
The average number of yearly fire incidents per 10k residents in Richardson, TX compared to nearest cities:
(Note: Based on data for the last 3 years, including only cities with population 5,000 and above)
| Richardson: | 18.0 |
| Plano: | 14.4 |
| Garland: | 25.0 |
| Addison: | 50.9 |
| Murphy: | 16.6 |
| Sachse: | 16.6 |
| University Park: | 15.3 |
| Farmers Branch: | 29.3 |
| Allen: | 14.0 |
 The median response time based on all reported fire incidents is 5 minutes. This is lower compared to the state median value.
The median response time in Richardson, TX compared to nearest cities:
(Note: Based on data for all years, including only cities with at least 500 fire incidents)
| Richardson: | 5 minutes |
| Plano: | 5 minutes |
| Garland: | 5 minutes |
| Addison: | 5 minutes |
| Sachse: | 6 minutes |
| University Park: | 5 minutes |
| Farmers Branch: | 5 minutes |
| Allen: | 6 minutes |
| Carrollton: | 5 minutes |
 Based on the data from the years 2002 - 2018 the average number of fire-related yearly deaths is 0. The highest number of reported deaths - 1 took place in 2002, and the lowest - 0 in 2003. The data has a constant trend.
The average number of deaths per 1,000 fire incidents is 1. This indicator was the highest - 5 in 2018, and the lowest 0 in 2003. The trend for deaths per 1,000 fire incidents is growing. Compared to the Texas value the number of deaths per 1,000 fires is similar.
Based on the data from the years 2002 - 2018 the average number of fire-related yearly deaths is 0. The highest number of reported deaths - 1 took place in 2002, and the lowest - 0 in 2003. The data has a constant trend.
The average number of deaths per 1,000 fire incidents is 1. This indicator was the highest - 5 in 2018, and the lowest 0 in 2003. The trend for deaths per 1,000 fire incidents is growing. Compared to the Texas value the number of deaths per 1,000 fires is similar.
 According to the data from the years 2002 - 2018 the average number of fire-related yearly casualties is 6. The highest number of reported injuries - 12 took place in 2007, and the lowest - 1 in 2013. The data has a declining trend.
The average number of injuries per 1,000 fires is 24. This indicator was the highest - 58 in 2007, and the lowest 5 in 2013. The trend for casualties per 1,000 fire incidents is declining. Compared to the Texas value the number of casualties per 1,000 fires is much higher.
According to the data from the years 2002 - 2018 the average number of fire-related yearly casualties is 6. The highest number of reported injuries - 12 took place in 2007, and the lowest - 1 in 2013. The data has a declining trend.
The average number of injuries per 1,000 fires is 24. This indicator was the highest - 58 in 2007, and the lowest 5 in 2013. The trend for casualties per 1,000 fire incidents is declining. Compared to the Texas value the number of casualties per 1,000 fires is much higher.Casualties per 1,000 incidents in Richardson, TX compared to nearest cities:
(Note: Based on data for all years, including only cities with at least 500 fire incidents)
| Richardson: | 24.9 |
| Plano: | 11.1 |
| Garland: | 5.4 |
| Addison: | 4.6 |
| Sachse: | 15.9 |
| University Park: | 5.9 |
| Farmers Branch: | 14.7 |
| Allen: | 7.1 |
| Carrollton: | 14.1 |
 31.5% incidents where reported in the morning and 68.5% in the evening. The most fires (14.9%) took place on Saturday, and the least (13.7%) on Wednesday.
 Based on the 3,930 fire incident reports from years 2002 - 2018 most fires (9.5%) took place during April, and the least (7.0%) in October.
 Out of all 67,541 cases reported during the years 2002 - 2018, the most belonged to the categories: Rescue & EMS (62.3%), Hazardous Condition (12.6%), and False Alarm (8.9%).
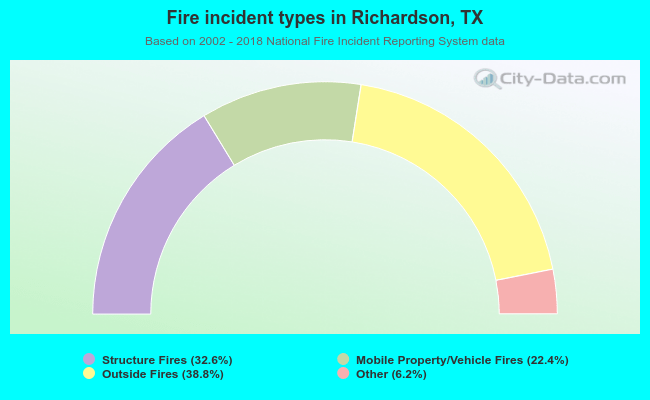 When looking into fire subcategories, the most reports belonged to: Outside Fires (38.8%), and Structure Fires (32.6%).