North Adams: Fire Incidents, Massachusetts (MA)
Where are fire incidents reported in North Adams, MA
Something went wrong! Please refresh the page.
| Fire incidents reported | |
|---|---|
| Sreet name | Count |
| ASHLAND ST | 82 |
| CHURCH ST | 78 |
| STATE RD | 64 |
| MOHAWK TRL | 60 |
| MAIN ST | 56 |
| EAGLE ST | 44 |
| RIVER ST | 44 |
| STATE ST | 42 |
| UNION ST | 40 |
| WEST MAIN ST | 38 |
| WEST SHAFT RD | 32 |
| BRACEWELL AVE | 30 |
| AMERICAN LEGION DR | 28 |
| CURRAN MEMORIAL HWY | 28 |
| MASSACHUSETTS AVE | 28 |
| VETERANS MEMORIAL DR | 28 |
| BRAYTON HILL TER | 26 |
| MOHAWK FOREST BLVD | 26 |
| EAST QUINCY ST | 24 |
| HALL ST | 22 |
| HOLDEN ST | 22 |
| MARSHALL ST | 22 |
| RESERVOIR RD | 20 |
| BARBOUR ST | 18 |
| LIBERTY ST | 18 |
| MASS AVE | 18 |
| MONTANA ST | 18 |
| NORTH ST | 18 |
| NOTCH RD | 18 |
| BEAVER ST | 16 |
2002 - 2018 National Fire Incident Reporting System (NFIRS) incidents
- Incident types reported to NFIRS in North Adams, MA
- 2,72128.3%Service Call
- 2,52626.2%Hazardous Condition
- 1,53816.0%False Alarm
- 1,27013.2%Rescue & EMS
- 8849.2%Fire
- 6266.5%Good Intent Call
- 460.5%Special Incident
- Fire incident types reported to NFIRS in North Adams, MA
- 41046.4%Structure Fires
- 24027.1%Outside Fires
- 12514.1%Other
- 10912.3%Mobile Property/Vehicle Fires
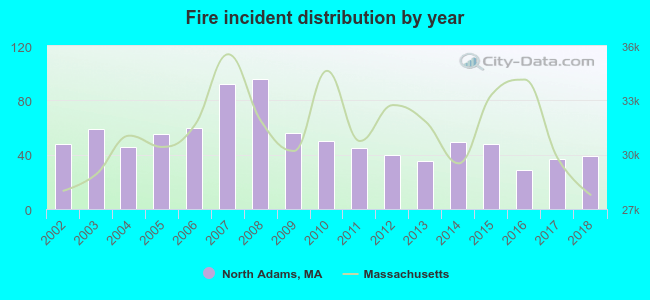 Based on the data from the years 2002 - 2018 the average number of fire incidents per year is 52. The highest number of reported fires - 96 took place in 2008, and the least - 29 in 2016. The data has a dropping trend.
The average number of yearly fire incidents per 10k residents in North Adams, MA compared to nearest cities:
(Note: Based on data for the last 3 years, including only cities with population 5,000 and above)
| North Adams: | 26.2 |
| Adams: | 73.1 |
| Dalton: | 30.1 |
| Pittsfield: | 51.0 |
| Greenfield: | 61.7 |
 The median response time based on all reported fire incidents is 4 minutes. This is close to the state median value.
The median response time in North Adams, MA compared to nearest cities:
(Note: Based on data for all years, including only cities with at least 500 fire incidents)
| North Adams: | 4 minutes |
| Adams: | 4 minutes |
| Pittsfield: | 5 minutes |
| Lenox: | 3 minutes |
| Greenfield: | 5 minutes |
 Based on the data from the years 2002 - 2018 the average number of fire-related casualties per year is 1. The highest number of casualties - 3 took place in 2006, and the lowest - 0 in 2002. The data has a constant trend.
The average number of casualties per 1,000 fires is 13. This indicator was the highest - 57 in 2013, and the lowest 0 in 2002. The trend for casualties per 1,000 fires is constant. Compared to the state value the number of casualties per 1,000 fires is higher.
Based on the data from the years 2002 - 2018 the average number of fire-related casualties per year is 1. The highest number of casualties - 3 took place in 2006, and the lowest - 0 in 2002. The data has a constant trend.
The average number of casualties per 1,000 fires is 13. This indicator was the highest - 57 in 2013, and the lowest 0 in 2002. The trend for casualties per 1,000 fires is constant. Compared to the state value the number of casualties per 1,000 fires is higher.Casualties per 1,000 incidents in North Adams, MA compared to nearest cities:
(Note: Based on data for all years, including only cities with at least 500 fire incidents)
| North Adams: | 13.6 |
| Adams: | 18.2 |
| Pittsfield: | 11.1 |
| Lenox: | 13.4 |
| Greenfield: | 15.7 |
 29.1% incidents where reported in the morning and 70.9% in the evening. The most fires (17.5%) took place on Friday, and the least (11.7%) on Wednesday.
 Based on the 884 incident reports from years 2002 - 2018 most fires (16.1%) took place during April, and the least (4.6%) in September.
 Out of all 9,625 cases reported during the years 2002 - 2018, the most belonged to the categories: Service Call (28.3%), Hazardous Condition (26.2%), and False Alarm (16.0%).
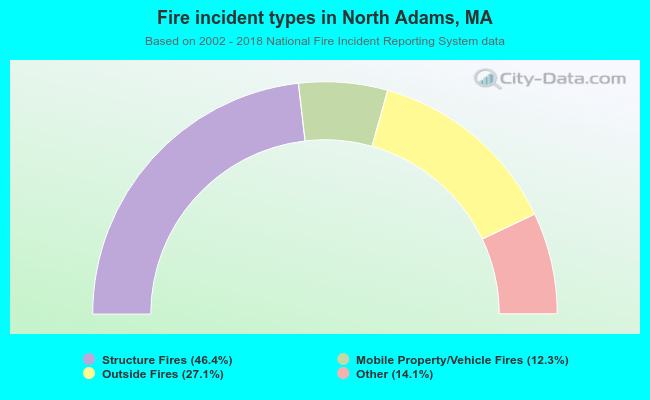 When looking into fire subcategories, the most reports belonged to: Structure Fires (46.4%), and Outside Fires (27.1%).