Milwaukie: Fire Incidents, Oregon (OR)
Where are fire incidents reported in Milwaukie, OR
Something went wrong! Please refresh the page.
| Fire incidents reported | |
|---|---|
| Sreet name | Count |
| MCLOUGHLIN BLVD | 504 |
| LAKE RD | 170 |
| RIVER RD | 152 |
| ROETHE RD | 112 |
| KING RD | 102 |
| OATFIELD RD | 90 |
| JOHNSON RD | 80 |
| MAIN ST | 80 |
| FULLER RD | 78 |
| WEBSTER RD | 72 |
| MONROE ST | 68 |
| COURTNEY AVE | 66 |
| OAK GROVE BLVD | 64 |
| LINWOOD AVE | 62 |
| JENNINGS AVE | 58 |
| 21ST AVE | 56 |
| ARISTA DR | 56 |
| HARRISON ST | 56 |
| HARMONY RD | 50 |
| INTERNATIONAL WAY | 50 |
| CONCORD RD | 48 |
| 82ND AVE | 44 |
| RISLEY AVE | 42 |
| 32ND AVE | 40 |
| JOHNSON CREEK BLVD | 40 |
| NAEF RD | 38 |
| OCHOCO ST | 38 |
| COOK CT | 36 |
| HWY 224 | 36 |
| 23RD AVE | 34 |
| Other | 77 |
2002 - 2018 National Fire Incident Reporting System (NFIRS) incidents
- Incident types reported to NFIRS in Milwaukie, OR
- 14,16058.3%Rescue & EMS
- 2,65510.9%Service Call
- 2,49910.3%Fire
- 2,48410.2%Hazardous Condition
- 1,7407.2%Good Intent Call
- 7543.1%False Alarm
- Fire incident types reported to NFIRS in Milwaukie, OR
- 1,25150.1%Structure Fires
- 85434.2%Outside Fires
- 32112.8%Mobile Property/Vehicle Fires
- 732.9%Other
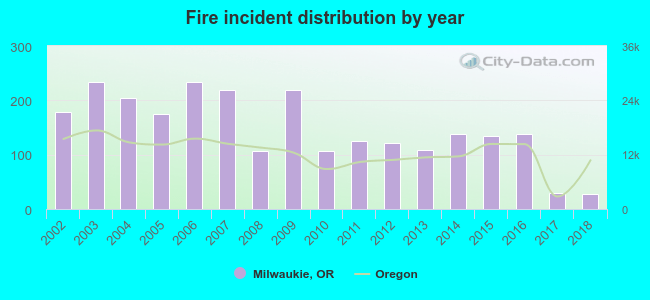 Based on the data from the years 2002 - 2018 the average number of fire incidents per year is 147. The highest number of fires - 233 took place in 2003, and the least - 27 in 2018. The data has a declining trend.
The average number of yearly fire incidents per 10k residents in Milwaukie, OR compared to nearest cities:
(Note: Based on data for the last 3 years, including only cities with population 5,000 and above)
| Milwaukie: | 31.5 |
| Oak Grove: | 1.6 |
| Clackamas: | 79.2 |
| Lake Oswego: | 12.6 |
| Happy Valley: | 20.6 |
| Gladstone: | 27.8 |
| Portland: | 17.5 |
| West Linn: | 8.0 |
| Oregon City: | 20.3 |
 The median response time based on all reported fire incidents is 5 minutes. This is lower than the Oregon median value.
The median response time in Milwaukie, OR compared to nearest cities:
(Note: Based on data for all years, including only cities with at least 500 fire incidents)
| Milwaukie: | 5 minutes |
| Clackamas: | 6 minutes |
| Lake Oswego: | 6 minutes |
| Happy Valley: | 5 minutes |
| Gladstone: | 5 minutes |
| Portland: | 5 minutes |
| West Linn: | 7 minutes |
| Oregon City: | 6 minutes |
| Tigard: | 6 minutes |
 According to the data from the years 2002 - 2018 the average number of fire-related fatalities per year is 1. The highest number of reported deaths - 3 took place in 2014, and the lowest - 0 in 2002. The data has a growing trend.
 Based on the data from the years 2002 - 2018 the average number of fire-related casualties per year is 4. The highest number of reported casualties - 10 took place in 2002, and the lowest - 0 in 2015. The data has a dropping trend.
The average number of injuries per 1,000 fires is 24. This indicator was the highest - 56 in 2002, and the lowest 0 in 2015. The trend for injuries per 1,000 incidents is dropping. Compared to the Oregon value the number of injuries per 1,000 incidents is higher.
Based on the data from the years 2002 - 2018 the average number of fire-related casualties per year is 4. The highest number of reported casualties - 10 took place in 2002, and the lowest - 0 in 2015. The data has a dropping trend.
The average number of injuries per 1,000 fires is 24. This indicator was the highest - 56 in 2002, and the lowest 0 in 2015. The trend for injuries per 1,000 incidents is dropping. Compared to the Oregon value the number of injuries per 1,000 incidents is higher.Casualties per 1,000 incidents in Milwaukie, OR compared to nearest cities:
(Note: Based on data for all years, including only cities with at least 500 fire incidents)
| Milwaukie: | 24.0 |
| Clackamas: | 14.0 |
| Lake Oswego: | 13.1 |
| Happy Valley: | 7.5 |
| Gladstone: | 5.0 |
| Portland: | 15.9 |
| West Linn: | 4.0 |
| Oregon City: | 9.7 |
| Tigard: | 16.8 |
 33.1% incidents where reported in the morning and 66.9% in the evening. The most fires (15.9%) took place on Saturday, and the least (13.5%) on Wednesday.
 Based on the 2,499 fires from years 2002 - 2018 most fires (16.6%) took place during July, and the least (6.2%) in March.
 Out of all 24,303 cases reported during the years 2002 - 2018, the most belonged to the categories: Rescue & EMS (58.3%), Service Call (10.9%), and Fire (10.3%).
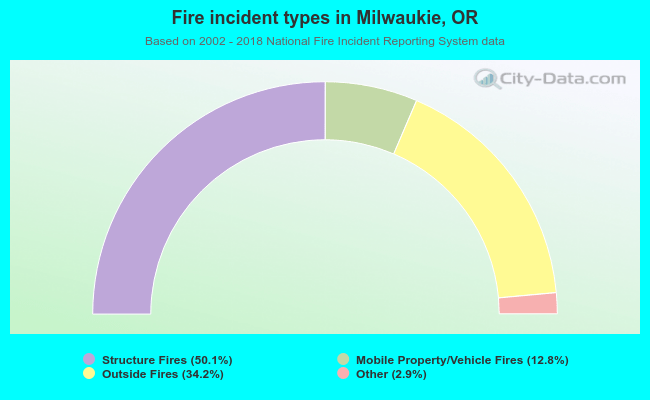 When looking into fire subcategories, the most incidents belonged to: Structure Fires (50.1%), and Outside Fires (34.2%).