Middle River: Fire Incidents, Maryland (MD)
Where are fire incidents reported in Middle River, MD
Something went wrong! Please refresh the page.
| Fire incidents reported | |
|---|---|
| Sreet name | Count |
| PULASKI HWY | 168 |
| MARTIN BLVD | 152 |
| EASTERN BLVD | 140 |
| MIDDLE RIVER RD | 136 |
| CARROLL ISLAND RD | 88 |
| COMPASS RD | 88 |
| KINGSTON RD | 74 |
| BOWLEYS QUARTERS RD | 68 |
| PHILADELPHIA RD | 54 |
| BIRD RIVER RD | 50 |
| FUSELAGE AVE | 48 |
| OREMS RD | 44 |
| WILSON POINT RD | 36 |
| CARROLLWOOD RD | 34 |
| EARLS RD | 34 |
| SOUTHORN RD | 34 |
| EASTERN AV | 30 |
| MAPLE DR | 30 |
| WAMPLER RD | 30 |
| GROVETHORN RD | 28 |
| OAK GROVE DR | 28 |
| EASTERN AVE | 26 |
| ALBERGE LN | 24 |
| BAYVILLE RD | 24 |
| BERLINER PL | 24 |
| RIVERTON RD | 24 |
| CHELMSFORD CT | 22 |
| FARWIND DR | 22 |
| BENGIES RD | 20 |
| PARK DR | 20 |
| Other | 273 |
2004 - 2018 National Fire Incident Reporting System (NFIRS) incidents
- Incident types reported to NFIRS in Middle River, MD
- 23,12173.8%Rescue & EMS
- 3,14610.0%Hazardous Condition
- 1,8736.0%Fire
- 1,1133.6%False Alarm
- 1,0273.3%Service Call
- 9943.2%Good Intent Call
- 510.2%Overpressure Rupture
- Fire incident types reported to NFIRS in Middle River, MD
- 1,16162.0%Outside Fires
- 36319.4%Structure Fires
- 26914.4%Mobile Property/Vehicle Fires
- 804.3%Other
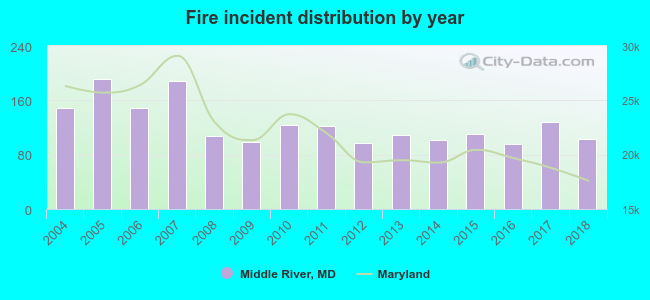 According to the data from the years 2004 - 2018 the average number of fires per year is 125. The highest number of reported fires - 191 took place in 2005, and the least - 96 in 2016. The data has a declining trend.
The average number of yearly fire incidents per 10k residents in Middle River, MD compared to nearest cities:
(Note: Based on data for the last 3 years, including only cities with population 5,000 and above)
| Middle River: | 43.3 |
| Essex: | 24.5 |
| White Marsh: | 31.9 |
| Rosedale: | 19.7 |
| Perry Hall: | 2.6 |
| Dundalk: | 13.6 |
| Parkville: | 23.6 |
| Edgemere: | 34.6 |
| Baltimore: | 47.1 |
 The median response time based on all reported fire incidents is 5 minutes. This is lower than the Maryland median value.
The median response time in Middle River, MD compared to nearest cities:
(Note: Based on data for all years, including only cities with at least 500 fire incidents)
| Middle River: | 5 minutes |
| Essex: | 5 minutes |
| Dundalk: | 5 minutes |
| Parkville: | 5 minutes |
| Edgemere: | 5 minutes |
| Baltimore: | 6 minutes |
| Edgewood: | 6 minutes |
| Towson: | 5 minutes |
| Fallston: | 8 minutes |
 According to the data from the years 2004 - 2018 the average number of fire-related yearly casualties is 0. The highest number of reported injuries - 1 took place in 2004, and the lowest - 0 in 2006. The data has a dropping trend.
The average number of injuries per 1,000 fire incidents is 3. This indicator was the highest - 10 in 2016, and the lowest 0 in 2006. The trend for injuries per 1,000 fire incidents is dropping. Compared to the Maryland value the number of injuries per 1,000 fire incidents is much lower.
According to the data from the years 2004 - 2018 the average number of fire-related yearly casualties is 0. The highest number of reported injuries - 1 took place in 2004, and the lowest - 0 in 2006. The data has a dropping trend.
The average number of injuries per 1,000 fire incidents is 3. This indicator was the highest - 10 in 2016, and the lowest 0 in 2006. The trend for injuries per 1,000 fire incidents is dropping. Compared to the Maryland value the number of injuries per 1,000 fire incidents is much lower.
 27.5% incidents where reported in the morning and 72.5% in the evening. The most fires (16.2%) took place on Sunday, and the least (12.8%) on Wednesday.
 Based on the 1,873 incident reports from years 2004 - 2018 most fires (12.0%) took place during July, and the least (5.9%) in January.
 Out of all 31,342 cases reported during the years 2004 - 2018, the most belonged to the categories: Rescue & EMS (73.8%), Hazardous Condition (10.0%), and Fire (6.0%).
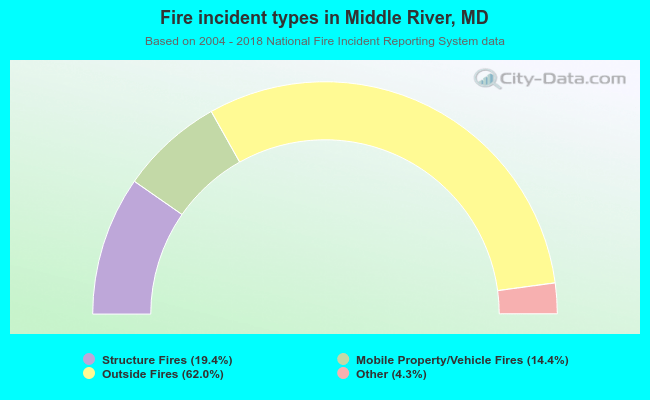 When looking into fire subcategories, the most incidents belonged to: Outside Fires (62.0%), and Structure Fires (19.4%).