Mahomet: Fire Incidents, Illinois (IL)
Where are fire incidents reported in Mahomet, IL
Something went wrong! Please refresh the page.
|
| |||||||||||||||||||||||||||||||||||||||||||||||||||||||||||||||||||||||||||||||||||||||||||||||||||||||||||||
| Other | 132 | |||||||||||||||||||||||||||||||||||||||||||||||||||||||||||||||||||||||||||||||||||||||||||||||||||||||||||||
2002 - 2018 National Fire Incident Reporting System (NFIRS) incidents
- Incident types reported to NFIRS in Mahomet, IL
- 3,84763.0%Rescue & EMS
- 72811.9%Fire
- 62610.2%Hazardous Condition
- 3235.3%Service Call
- 3004.9%False Alarm
- 2684.4%Good Intent Call
- Fire incident types reported to NFIRS in Mahomet, IL
- 32244.2%Outside Fires
- 26035.7%Structure Fires
- 9212.6%Mobile Property/Vehicle Fires
- 547.4%Other
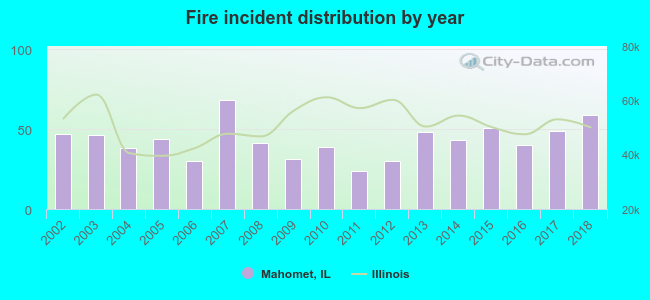 Based on the data from the years 2002 - 2018 the average number of fires per year is 43. The highest number of fires - 68 took place in 2007, and the least - 24 in 2011. The data has an increasing trend.
 The median response time based on all reported fire incidents is 9 minutes. This is higher than the Illinois median value.
 31.2% incidents where reported in the morning and 68.8% in the evening. The most fires (16.1%) took place on Saturday, and the least (11.3%) on Thursday.
 Based on the 728 fire incident reports from years 2002 - 2018 most fires (12.1%) took place during April, and the least (4.0%) in December.
 Out of all 6,108 cases reported during the years 2002 - 2018, the most belonged to the categories: Rescue & EMS (63.0%), Fire (11.9%), and Hazardous Condition (10.2%).
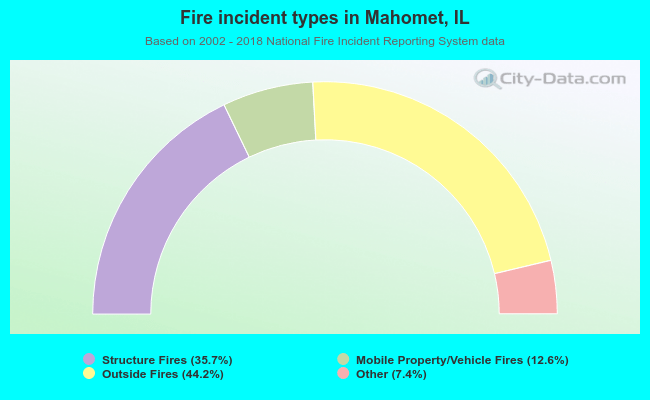 When looking into fire subcategories, the most incidents belonged to: Outside Fires (44.2%), and Structure Fires (35.7%).