Lisbon: Fire Incidents, Maine (ME)
Where are fire incidents reported in Lisbon, ME
Something went wrong! Please refresh the page.
|
| |||||||||||||||||||||||||||||||||||||||||||||||||||||||||||||||||||||||||||||||||||||||||||||||||||||||||||||
2003 - 2018 National Fire Incident Reporting System (NFIRS) incidents
- Incident types reported to NFIRS in Lisbon, ME
- 35722.5%Rescue & EMS
- 30018.9%Service Call
- 29818.8%Good Intent Call
- 25816.2%Hazardous Condition
- 19312.1%Fire
- 16310.3%False Alarm
- 100.6%Severe Weather
- 60.4%Overpressure Rupture
- 40.3%Special Incident
- Fire incident types reported to NFIRS in Lisbon, ME
- 13167.9%Structure Fires
- 2915.0%Outside Fires
- 2211.4%Mobile Property/Vehicle Fires
- 115.7%Other
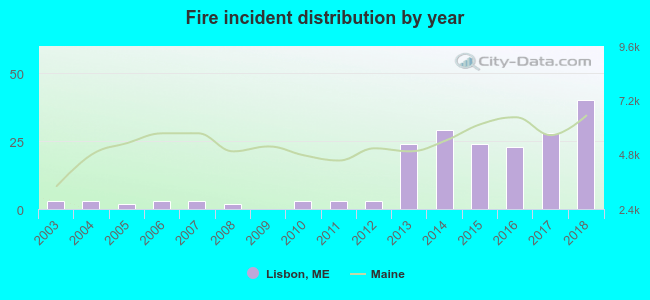 According to the data from the years 2003 - 2018 the average number of fires per year is 12. The highest number of fire incidents - 40 took place in 2018, and the least - 0 in 2009. The data has an increasing trend.
The average number of yearly fire incidents per 10k residents in Lisbon, ME compared to nearest cities:
(Note: Based on data for the last 3 years, including only cities with population 5,000 and above)
| Lisbon: | 33.7 |
| Lewiston: | 43.4 |
| Topsham: | 38.2 |
| Auburn: | 50.8 |
| Brunswick: | 68.8 |
| New Gloucester: | 31.9 |
| Bath: | 53.3 |
| Poland: | 62.0 |
| Yarmouth: | 36.3 |

 34.2% incidents where reported in the morning and 65.8% in the evening. The most fires (19.2%) took place on Saturday, and the least (10.9%) on Friday.
 According to the 193 reports from years 2003 - 2018 most fires (12.4%) took place during December, and the least (3.6%) in September.
 Out of all 1,589 cases reported during the years 2003 - 2018, the most belonged to the categories: Rescue & EMS (22.5%), Service Call (18.9%), and Good Intent Call (18.8%).
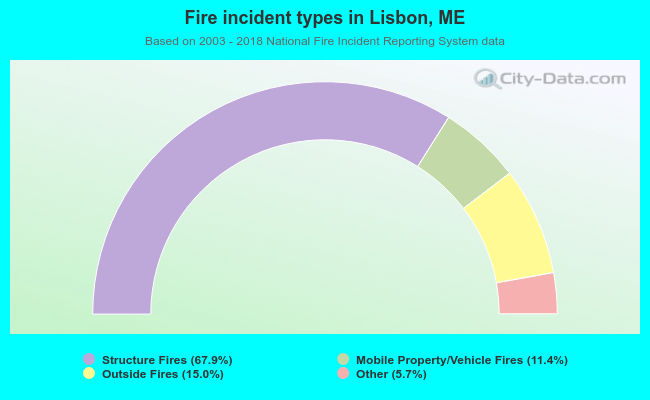 When looking into fire subcategories, the most reports belonged to: Structure Fires (67.9%), and Outside Fires (15.0%).