Lake Zurich: Fire Incidents, Illinois (IL)
Where are fire incidents reported in Lake Zurich, IL
Something went wrong! Please refresh the page.
| Fire incidents reported | |
|---|---|
| Sreet name | Count |
| RAND RD | 134 |
| MAIN ST | 72 |
| OLD RAND RD | 60 |
| BUESCHING RD | 56 |
| ELA RD | 34 |
| MILLER RD | 34 |
| OAKWOOD RD | 34 |
| CHURCH ST | 32 |
| LAKEWOOD LN | 32 |
| QUENTIN RD | 32 |
| GLENDALE RD | 30 |
| RAND ROAD (ROUTE 12) | 28 |
| SOMERSET CT | 26 |
| MIDLOTHIAN RD | 22 |
| OVERHILL DR | 22 |
| LAKESIDE DR | 20 |
| OLD MILL GROVE RD | 20 |
| RAND | 20 |
| MAIN | 18 |
| OLD MCHENRY RD | 18 |
| ROUTE 22 | 18 |
| TRACIE DR | 18 |
| WHITNEY RD | 18 |
| PINE TREE ROW | 16 |
| RED BRIDGE RD | 16 |
| S RAND RD RT | 16 |
| LOUISE CT | 14 |
| MELODY | 14 |
| PINE TREE ROW | 14 |
| QUENTIN | 14 |
| Other | 348 |
2002 - 2018 National Fire Incident Reporting System (NFIRS) incidents
- Incident types reported to NFIRS in Lake Zurich, IL
- 9,02753.9%Rescue & EMS
- 2,63315.7%Service Call
- 1,76710.6%False Alarm
- 1,3628.1%Hazardous Condition
- 1,2507.5%Fire
- 6784.1%Good Intent Call
- Fire incident types reported to NFIRS in Lake Zurich, IL
- 90772.6%Structure Fires
- 23118.5%Outside Fires
- 665.3%Mobile Property/Vehicle Fires
- 463.7%Other
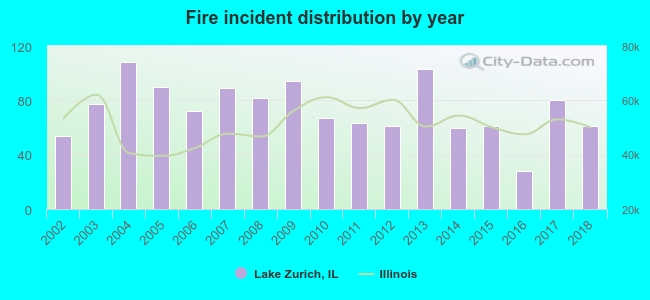 Based on the data from the years 2002 - 2018 the average number of fire incidents per year is 74. The highest number of reported fire incidents - 108 took place in 2004, and the least - 28 in 2016. The data has a rising trend.
The average number of yearly fire incidents per 10k residents in Lake Zurich, IL compared to nearest cities:
(Note: Based on data for the last 3 years, including only cities with population 5,000 and above)
| Lake Zurich: | 28.1 |
| Hawthorn Woods: | 20.7 |
| Barrington: | 52.1 |
| Long Grove: | 40.7 |
| Inverness: | 18.9 |
| Palatine: | 20.6 |
| Wauconda: | 41.0 |
| Mundelein: | 26.3 |
| Buffalo Grove: | 20.4 |
 The median response time based on all reported fire incidents is 8 minutes. This is higher compared to the state median value.
The median response time in Lake Zurich, IL compared to nearest cities:
(Note: Based on data for all years, including only cities with at least 500 fire incidents)
| Lake Zurich: | 8 minutes |
| Barrington: | 7 minutes |
| Long Grove: | 7 minutes |
| Palatine: | 5 minutes |
| Wauconda: | 6 minutes |
| Mundelein: | 5 minutes |
| Buffalo Grove: | 5 minutes |
| Vernon Hills: | 5 minutes |
| Cary: | 5 minutes |
 Based on the data from the years 2002 - 2018 the average number of fire-related casualties per year is 2. The highest number of reported casualties - 7 took place in 2007, and the lowest - 0 in 2002. The data has a rising trend.
The average number of casualties per 1,000 fires is 21. This indicator was the highest - 79 in 2007, and the lowest 0 in 2002. The trend for injuries per 1,000 incidents is rising. Compared to the Illinois value the number of injuries per 1,000 fires is much higher.
Based on the data from the years 2002 - 2018 the average number of fire-related casualties per year is 2. The highest number of reported casualties - 7 took place in 2007, and the lowest - 0 in 2002. The data has a rising trend.
The average number of casualties per 1,000 fires is 21. This indicator was the highest - 79 in 2007, and the lowest 0 in 2002. The trend for injuries per 1,000 incidents is rising. Compared to the Illinois value the number of injuries per 1,000 fires is much higher.Casualties per 1,000 incidents in Lake Zurich, IL compared to nearest cities:
(Note: Based on data for all years, including only cities with at least 500 fire incidents)
| Lake Zurich: | 23.2 |
| Barrington: | 5.8 |
| Long Grove: | 45.5 |
| Palatine: | 16.4 |
| Wauconda: | 7.1 |
| Mundelein: | 10.6 |
| Buffalo Grove: | 19.4 |
| Vernon Hills: | 25.7 |
| Cary: | 1.4 |
 34.0% incidents where reported in the morning and 66.0% in the evening. The most fires (18.0%) took place on Sunday, and the least (10.2%) on Tuesday.
 Based on the 1,250 reports from years 2002 - 2018 most fires (11.0%) took place during August, and the least (6.2%) in December.
 Out of all 16,733 cases reported during the years 2002 - 2018, the most belonged to the categories: Rescue & EMS (53.9%), Service Call (15.7%), and False Alarm (10.6%).
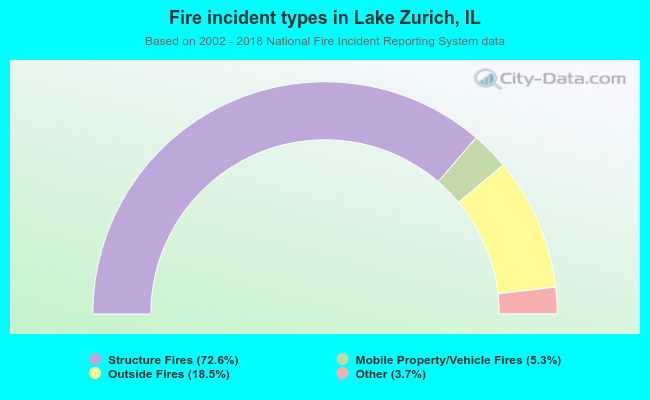 When looking into fire subcategories, the most incidents belonged to: Structure Fires (72.6%), and Outside Fires (18.5%).