Kentfield: Fire Incidents, California (CA)
Where are fire incidents reported in Kentfield, CA
Something went wrong! Please refresh the page.
|
| |||||||||||||||||||||||||||||||||||||||||||||||||||||||||||||||||||||||||||||||||||||||||||||||||||||||||||||
2002 - 2018 National Fire Incident Reporting System (NFIRS) incidents
- Incident types reported to NFIRS in Kentfield, CA
- 2,10249.1%Rescue & EMS
- 71316.7%Good Intent Call
- 58613.7%Service Call
- 3728.7%False Alarm
- 2626.1%Hazardous Condition
- 2225.2%Fire
- 140.3%Severe Weather
- 90.2%Special Incident
- Fire incident types reported to NFIRS in Kentfield, CA
- 10245.9%Structure Fires
- 7533.8%Outside Fires
- 2511.3%Other
- 209.0%Mobile Property/Vehicle Fires
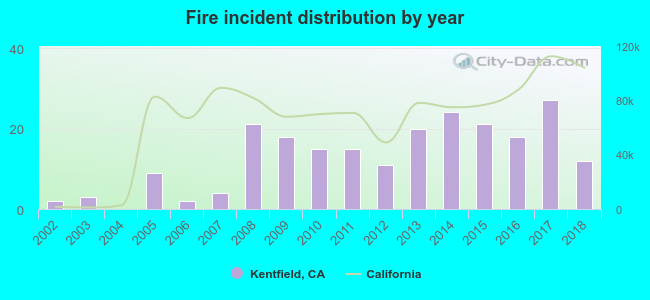 According to the data from the years 2002 - 2018 the average number of fire incidents per year is 13. The highest number of fire incidents - 27 took place in 2017, and the least - 0 in 2004. The data has a growing trend.
The average number of yearly fire incidents per 10k residents in Kentfield, CA compared to nearest cities:
(Note: Based on data for the last 3 years, including only cities with population 5,000 and above)
| Kentfield: | 29.3 |
| Larkspur: | 14.9 |
| San Anselmo: | 18.7 |
| Corte Madera: | 29.2 |
| San Rafael: | 28.9 |
| Mill Valley: | 43.0 |
| Fairfax: | 24.4 |
| Strawberry: | 6.2 |
| Tiburon: | 19.9 |

 32.4% incidents where reported in the morning and 67.6% in the evening. The most fires (19.4%) took place on Thursday, and the least (9.0%) on Monday.
 According to the 222 fires from years 2002 - 2018 most fires (11.7%) took place during May, and the least (4.1%) in December.
 Out of all 4,282 cases reported during the years 2002 - 2018, the most belonged to the categories: Rescue & EMS (49.1%), Good Intent Call (16.7%), and Service Call (13.7%).
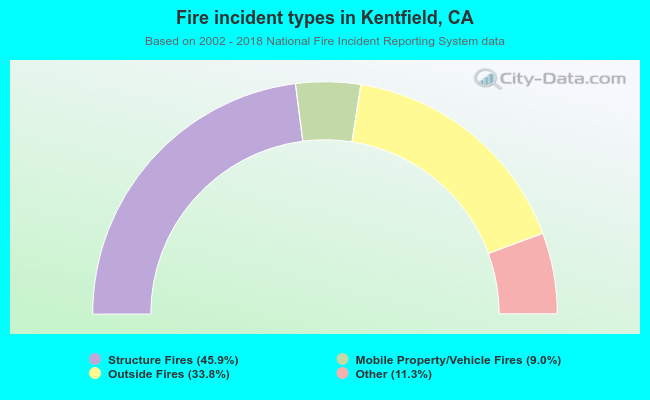 When looking into fire subcategories, the most reports belonged to: Structure Fires (45.9%), and Outside Fires (33.8%).