Jamul: Fire Incidents, California (CA)
Where are fire incidents reported in Jamul, CA
Something went wrong! Please refresh the page.
|
| |||||||||||||||||||||||||||||||||||||||||||||||||||||||||||||||||||||||||||||||||||||||||||||||||||||||||||||
2005 - 2018 National Fire Incident Reporting System (NFIRS) incidents
- Incident types reported to NFIRS in Jamul, CA
- 1,25859.6%Rescue & EMS
- 39618.8%Fire
- 1838.7%Service Call
- 1065.0%Good Intent Call
- 1044.9%False Alarm
- 612.9%Hazardous Condition
- Fire incident types reported to NFIRS in Jamul, CA
- 17042.9%Structure Fires
- 15438.9%Outside Fires
- 4611.6%Mobile Property/Vehicle Fires
- 266.6%Other
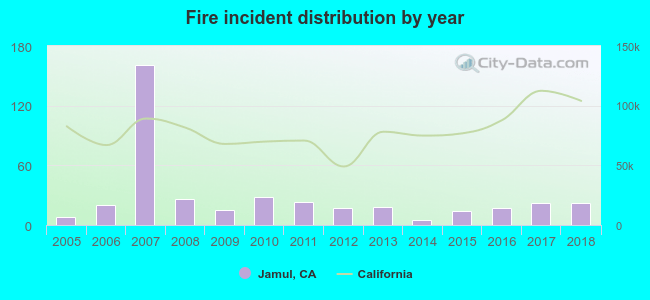 According to the data from the years 2005 - 2018 the average number of fires per year is 28. The highest number of reported fire incidents - 161 took place in 2007, and the least - 5 in 2014. The data has a rising trend.
The average number of yearly fire incidents per 10k residents in Jamul, CA compared to nearest cities:
(Note: Based on data for the last 3 years, including only cities with population 5,000 and above)
| Jamul: | 33.0 |
| Spring Valley: | 11.8 |
| El Cajon: | 14.4 |
| Lakeside: | 55.2 |
| La Mesa: | 6.2 |
| Lemon Grove: | 8.2 |
| Alpine: | 48.0 |
| Bonita: | 16.7 |
| Santee: | 16.9 |

 53.3% incidents where reported in the morning and 46.7% in the evening. The most fires (44.4%) took place on Sunday, and the least (8.1%) on Monday.
 Based on the 396 fire incident reports from years 2005 - 2018 most fires (37.9%) took place during October, and the least (2.5%) in March.
 Out of all 2,109 cases reported during the years 2005 - 2018, the most belonged to the categories: Rescue & EMS (59.6%), Fire (18.8%), and Service Call (8.7%).
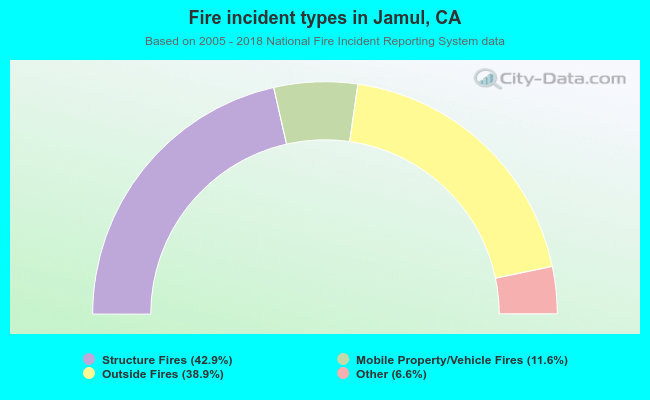 When looking into fire subcategories, the most incidents belonged to: Structure Fires (42.9%), and Outside Fires (38.9%).