Independence: Fire Incidents, Kentucky (KY)
Where are fire incidents reported in Independence, KY
Something went wrong! Please refresh the page.
| Fire incidents reported | |
|---|---|
| Sreet name | Count |
| MADISON PIKE | 92 |
| RICHARDSON RD | 74 |
| TAYLOR MILL RD | 66 |
| INDEPENDENCE RD | 40 |
| BEECHGROVE DR | 38 |
| BOWMAN RD | 38 |
| BRISTOW RD | 36 |
| INDEPENDENCE STATION RD | 30 |
| BANKLICK RD | 28 |
| REGAL RIDGE RD | 26 |
| APPLE VALLEY DR | 24 |
| CODY RD | 24 |
| DECLARATION DR | 24 |
| TURKEYFOOT RD | 24 |
| SYLVAN DR | 20 |
| WALTON NICHOLSON RD | 20 |
| WILSON RD | 20 |
| CHARWOOD CIR | 18 |
| SUMMITRUN DR | 18 |
| WEBSTER RD | 16 |
| WYNNBROOK DR | 16 |
| HOLTON DR | 14 |
| MARSHALL RD | 14 |
| OLIVER RD | 14 |
| STAFFORDSBURG RD | 14 |
| RIGGS RD | 12 |
| STEPHENS RD | 12 |
| APPLEWOOD CT | 10 |
| ASPEN DR | 10 |
| CENTENNIAL BLVD | 10 |
| Other | 151 |
2005 - 2018 National Fire Incident Reporting System (NFIRS) incidents
- Incident types reported to NFIRS in Independence, KY
- 3,42445.3%Rescue & EMS
- 1,14215.1%Good Intent Call
- 1,04413.8%Hazardous Condition
- 95312.6%Fire
- 5417.2%False Alarm
- 3614.8%Service Call
- 741.0%Severe Weather
- 110.1%Overpressure Rupture
- 100.1%Special Incident
- Fire incident types reported to NFIRS in Independence, KY
- 43846.0%Outside Fires
- 37138.9%Structure Fires
- 10010.5%Mobile Property/Vehicle Fires
- 444.6%Other
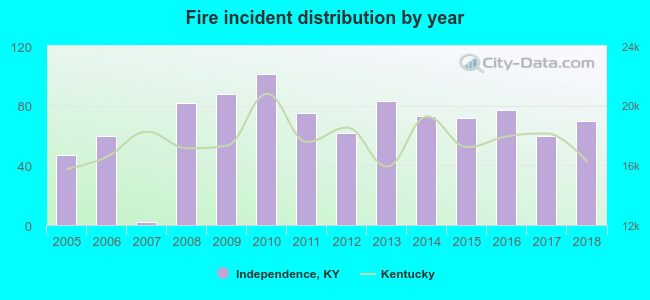 According to the data from the years 2005 - 2018 the average number of fires per year is 68. The highest number of reported fire incidents - 101 took place in 2010, and the least - 2 in 2007. The data has a rising trend.
The average number of yearly fire incidents per 10k residents in Independence, KY compared to nearest cities:
(Note: Based on data for the last 3 years, including only cities with population 5,000 and above)
| Independence: | 26.2 |
| Edgewood: | 17.9 |
| Elsmere: | 33.3 |
| Erlanger: | 44.2 |
| Taylor Mill: | 24.8 |
| Florence: | 68.6 |
| Fort Mitchell: | 26.6 |
| Union: | 36.6 |
| Fort Wright: | 20.3 |
 The median response time based on all reported fire incidents is 5 minutes. This is lower than the Kentucky median value.
The median response time in Independence, KY compared to nearest cities:
(Note: Based on data for all years, including only cities with at least 500 fire incidents)
| Independence: | 5 minutes |
| Erlanger: | 5 minutes |
| Florence: | 6 minutes |
| Fort Wright: | 6 minutes |
| Covington: | 4 minutes |
| Alexandria: | 7 minutes |
| Newport: | 4 minutes |
| Burlington: | 7 minutes |
| Hebron: | 6 minutes |
 According to the reports from the years 2005 - 2018 the average number of fire-related yearly casualties is 1. The highest number of reported casualties - 2 took place in 2014, and the lowest - 0 in 2005. The data has a constant trend.
The average number of casualties per 1,000 fire incidents is 8. This indicator was the highest - 33 in 2017, and the lowest 0 in 2005. The trend for casualties per 1,000 incidents is constant. Compared to the state value the number of injuries per 1,000 fires is about the same.
According to the reports from the years 2005 - 2018 the average number of fire-related yearly casualties is 1. The highest number of reported casualties - 2 took place in 2014, and the lowest - 0 in 2005. The data has a constant trend.
The average number of casualties per 1,000 fire incidents is 8. This indicator was the highest - 33 in 2017, and the lowest 0 in 2005. The trend for casualties per 1,000 incidents is constant. Compared to the state value the number of injuries per 1,000 fires is about the same.Casualties per 1,000 incidents in Independence, KY compared to nearest cities:
(Note: Based on data for all years, including only cities with at least 500 fire incidents)
| Independence: | 8.4 |
| Erlanger: | 5.0 |
| Florence: | 14.5 |
| Fort Wright: | 3.9 |
| Covington: | 14.0 |
| Alexandria: | 14.1 |
| Newport: | 20.2 |
| Burlington: | 14.4 |
| Hebron: | 3.9 |
 26.3% incidents where reported in the morning and 73.7% in the evening. The most fires (17.0%) took place on Saturday, and the least (12.4%) on Friday.
 According to the 953 incident reports from years 2005 - 2018 most fires (10.3%) took place during April, and the least (6.0%) in January.
 Out of all 7,560 cases reported during the years 2005 - 2018, the most belonged to the categories: Rescue & EMS (45.3%), Good Intent Call (15.1%), and Hazardous Condition (13.8%).
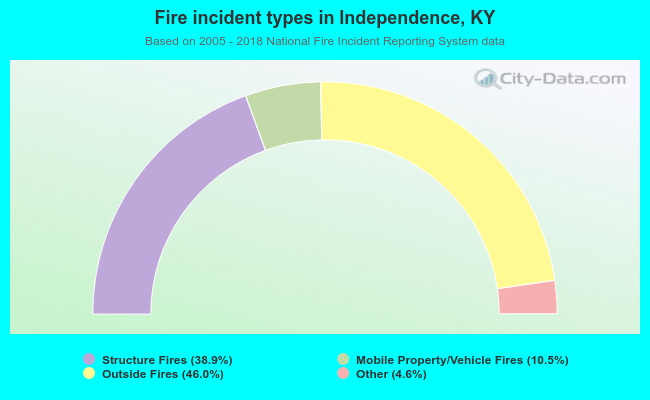 When looking into fire subcategories, the most reports belonged to: Outside Fires (46.0%), and Structure Fires (38.9%).