Huntington Park: Fire Incidents, California (CA)
Where are fire incidents reported in Huntington Park, CA
Something went wrong! Please refresh the page.
| Fire incidents reported | |
|---|---|
| Sreet name | Count |
| FLORENCE | 142 |
| RANDOLPH | 140 |
| PACIFIC | 122 |
| SLAUSON | 114 |
| GAGE | 112 |
| SEVILLE | 104 |
| RUGBY | 94 |
| MALABAR | 80 |
| SANTA FE | 66 |
| TEMPLETON | 58 |
| STATE | 52 |
| ALBANY | 48 |
| RITA | 46 |
| ALAMEDA | 42 |
| SATURN | 42 |
| CLARENDON | 40 |
| MIDDLETON | 40 |
| MILES | 40 |
| STAFFORD | 36 |
| BELGRAVE | 34 |
| MARBRISA | 32 |
| NEWELL | 30 |
| 57TH | 26 |
| CALIFORNIA | 26 |
| COTTAGE | 26 |
| REGENT | 26 |
| 60TH | 24 |
| CARMELITA | 24 |
| HOOD | 24 |
| ZOE | 24 |
2005 - 2018 National Fire Incident Reporting System (NFIRS) incidents
- Incident types reported to NFIRS in Huntington Park, CA
- 11,89465.5%Rescue & EMS
- 3,30518.2%Good Intent Call
- 1,1076.1%Fire
- 1,0075.5%False Alarm
- 4842.7%Hazardous Condition
- 3241.8%Service Call
- 250.1%Overpressure Rupture
- Fire incident types reported to NFIRS in Huntington Park, CA
- 44340.0%Outside Fires
- 37734.1%Structure Fires
- 19918.0%Mobile Property/Vehicle Fires
- 887.9%Other
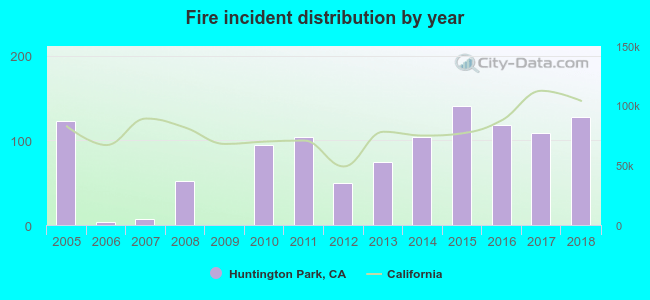 According to the data from the years 2005 - 2018 the average number of fires per year is 79. The highest number of fires - 141 took place in 2015, and the least - 0 in 2009. The data has a rising trend.
The average number of yearly fire incidents per 10k residents in Huntington Park, CA compared to nearest cities:
(Note: Based on data for the last 3 years, including only cities with population 5,000 and above)
| Huntington Park: | 19.9 |
| Walnut Park: | 11.5 |
| Maywood: | 12.2 |
| Bell: | 19.0 |
| Cudahy: | 13.6 |
| South Gate: | 15.8 |
| Bell Gardens: | 18.3 |
| Commerce: | 70.9 |
| Lynwood: | 19.4 |
 The median response time based on all reported fire incidents is 4 minutes. This is lower than the California median value.
The median response time in Huntington Park, CA compared to nearest cities:
(Note: Based on data for all years, including only cities with at least 500 fire incidents)
| Huntington Park: | 4 minutes |
| Vernon: | 5 minutes |
| Bell: | 5 minutes |
| South Gate: | 5 minutes |
| Bell Gardens: | 5 minutes |
| Commerce: | 5 minutes |
| Lynwood: | 4 minutes |
| East Los Angeles: | 5 minutes |
| Downey: | 7 minutes |
 35.9% incidents where reported in the morning and 64.1% in the evening. The most fires (15.9%) took place on Friday, and the least (12.6%) on Wednesday.
 According to the 1,107 fire incidents from years 2005 - 2018 most fires (13.9%) took place during January, and the least (5.9%) in December.
 Out of all 18,161 cases reported during the years 2005 - 2018, the most belonged to the categories: Rescue & EMS (65.5%), Good Intent Call (18.2%), and Fire (6.1%).
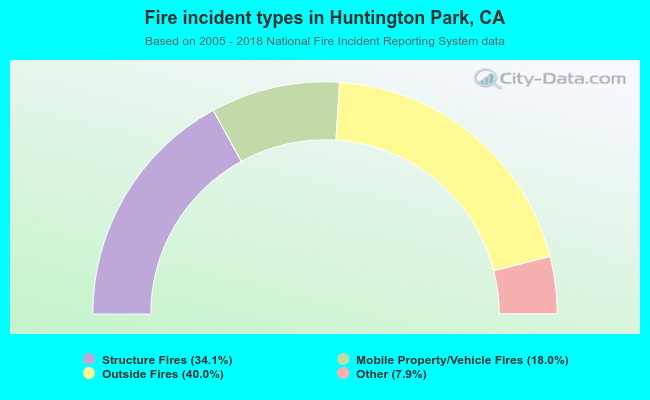 When looking into fire subcategories, the most incidents belonged to: Outside Fires (40.0%), and Structure Fires (34.1%).