Gonzales: Fire Incidents, Texas (TX)
Where are fire incidents reported in Gonzales, TX
Something went wrong! Please refresh the page.
|
| |||||||||||||||||||||||||||||||||||||||||||||||||||||||||||||||||||||||||||||||||||||||||||||||||||||||||||||
| Other | 2 | |||||||||||||||||||||||||||||||||||||||||||||||||||||||||||||||||||||||||||||||||||||||||||||||||||||||||||||
2004 - 2018 National Fire Incident Reporting System (NFIRS) incidents
- Incident types reported to NFIRS in Gonzales, TX
- 68234.8%Fire
- 38019.4%Hazardous Condition
- 33917.3%Rescue & EMS
- 23912.2%Good Intent Call
- 21210.8%False Alarm
- 773.9%Service Call
- 150.8%Overpressure Rupture
- 130.7%Special Incident
- Fire incident types reported to NFIRS in Gonzales, TX
- 42462.2%Outside Fires
- 11016.1%Structure Fires
- 10916.0%Mobile Property/Vehicle Fires
- 395.7%Other
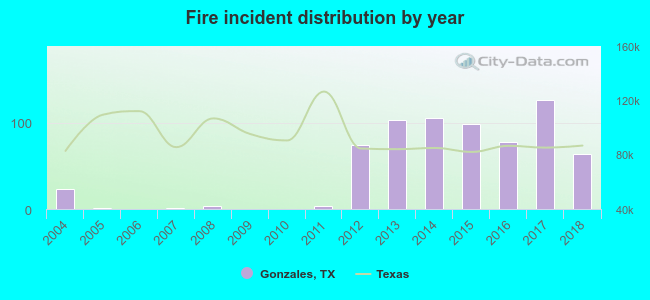 According to the data from the years 2004 - 2018 the average number of fires per year is 45. The highest number of reported fires - 126 took place in 2017, and the least - 0 in 2006. The data has a rising trend.
The average number of yearly fire incidents per 10k residents in Gonzales, TX compared to nearest cities:
(Note: Based on data for the last 3 years, including only cities with population 5,000 and above)
| Gonzales: | 119.7 |
| Luling: | 121.5 |
| Yoakum: | 110.2 |
| Lockhart: | 41.1 |
| Cuero: | 49.1 |
| Seguin: | 98.9 |
| San Marcos: | 45.9 |
| Kyle: | 50.3 |
| Bastrop: | 180.3 |
 The median response time based on all reported fire incidents is 9 minutes. This is higher compared to the state median value.
The median response time in Gonzales, TX compared to nearest cities:
(Note: Based on data for all years, including only cities with at least 500 fire incidents)
| Gonzales: | 9 minutes |
| Luling: | 8 minutes |
| Yoakum: | 6 minutes |
| Flatonia: | 0 minutes |
| Lockhart: | 5 minutes |
| Cuero: | 7 minutes |
| Hallettsville: | 11 minutes |
| Seguin: | 8 minutes |
| Schulenburg: | 7 minutes |
 27.3% incidents where reported in the morning and 72.7% in the evening. The most fires (19.4%) took place on Monday, and the least (11.0%) on Sunday.
 Based on the 682 fire incidents from years 2004 - 2018 most fires (13.2%) took place during July, and the least (5.0%) in November.
 Out of all 1,957 cases reported during the years 2004 - 2018, the most belonged to the categories: Fire (34.8%), Hazardous Condition (19.4%), and Rescue & EMS (17.3%).
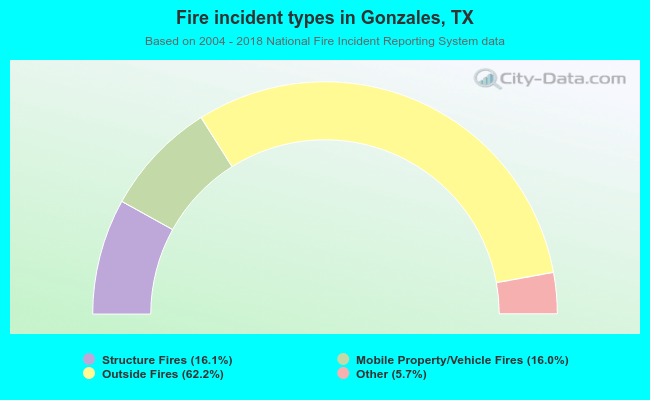 When looking into fire subcategories, the most incidents belonged to: Outside Fires (62.2%), and Structure Fires (16.1%).