Glenville: Fire Incidents, New York (NY)
Where are fire incidents reported in Glenville, NY
Something went wrong! Please refresh the page.
| Fire incidents reported | |
|---|---|
| Sreet name | Count |
| SARATOGART50 RD | 326 |
| DUTCH MEADOWS LN | 232 |
| GLENRIDGE RD | 148 |
| TRYON AVE | 108 |
| MAPLE AVE | 74 |
| FREEMANS BRIDGE RD | 70 |
| SACANDAGA RD | 64 |
| FREEMANS BRIDGE ROAD | 62 |
| DROMS RD | 60 |
| HETCHELTOWN RD | 60 |
| CHARLTON RD | 54 |
| BIRCH LN | 52 |
| SARATOGA ROAD | 44 |
| AMSTERDAM RD | 40 |
| TRYON AVE | 40 |
| SWAGGERTOWN RD | 36 |
| HEATHER LANE | 30 |
| FREDRICKS RD | 20 |
| PASHLEY RD | 18 |
| DOROTHY LN | 16 |
| HAVENBROOK DR | 16 |
| HORSTMAN DRIVE | 16 |
| JANE DR | 16 |
| LAKEHILL RD | 16 |
| OAK HILL DRIVE | 16 |
| SARNOWSKI DR | 16 |
| TOWER RD | 16 |
| MAPLE AVE | 14 |
| RIDGE RD | 14 |
| SWAGGERTOWN ROAD | 14 |
2003 - 2018 National Fire Incident Reporting System (NFIRS) incidents
- Incident types reported to NFIRS in Glenville, NY
- 5,79557.8%Rescue & EMS
- 1,35613.5%Fire
- 8018.0%Hazardous Condition
- 7327.3%Service Call
- 6586.6%False Alarm
- 6566.5%Good Intent Call
- 140.1%Severe Weather
- Fire incident types reported to NFIRS in Glenville, NY
- 83161.3%Other
- 37327.5%Structure Fires
- 977.2%Outside Fires
- 554.1%Mobile Property/Vehicle Fires
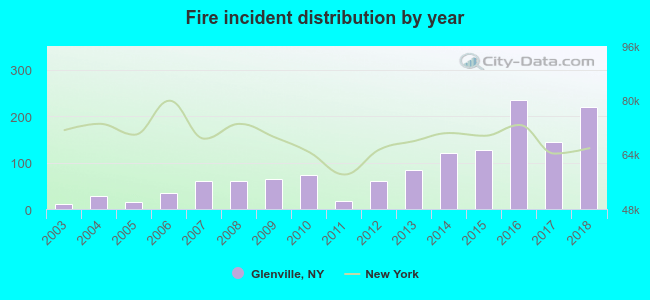 According to the data from the years 2003 - 2018 the average number of fires per year is 85. The highest number of fires - 234 took place in 2016, and the least - 10 in 2003. The data has a growing trend.
The average number of yearly fire incidents per 10k residents in Glenville, NY compared to nearest cities:
(Note: Based on data for the last 3 years, including only cities with population 5,000 and above)
| Glenville: | 67.6 |
| Scotia: | 26.9 |
| East Glenville: | 1.5 |
| Schenectady: | 72.1 |
| Rotterdam: | 1.0 |
| Clifton Park: | 34.1 |
| Malta: | 29.1 |
| Halfmoon: | 15.6 |
| Guilderland: | 7.3 |
 The median response time based on all reported fire incidents is 4 minutes. This is comparable to the New York median value.
The median response time in Glenville, NY compared to nearest cities:
(Note: Based on data for all years, including only cities with at least 500 fire incidents)
| Glenville: | 4 minutes |
| Schenectady: | 4 minutes |
| Niskayuna: | 4 minutes |
| Clifton Park: | 6 minutes |
| Halfmoon: | 6 minutes |
| Colonie: | 7 minutes |
| Amsterdam: | 4 minutes |
| Mechanicville: | 5 minutes |
| Cohoes: | 4 minutes |
 38.1% incidents where reported in the morning and 61.9% in the evening. The most fires (15.9%) took place on Tuesday, and the least (11.9%) on Sunday.
 According to the 1,356 reports from years 2003 - 2018 most fires (9.9%) took place during November, and the least (7.2%) in February.
 Out of all 10,023 cases reported during the years 2003 - 2018, the most belonged to the categories: Rescue & EMS (57.8%), Fire (13.5%), and Hazardous Condition (8.0%).
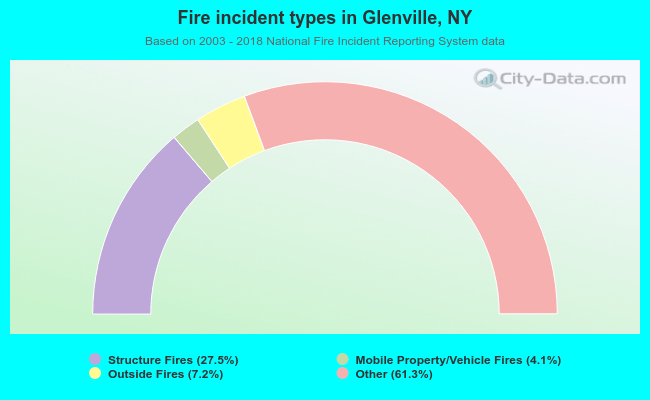 When looking into fire subcategories, the most reports belonged to: Other (61.3%), and Structure Fires (27.5%).