Gilford: Fire Incidents, New Hampshire (NH)
Where are fire incidents reported in Gilford, NH
Something went wrong! Please refresh the page.
| Fire incidents reported | |
|---|---|
| Sreet name | Count |
| LAKESHORE RD | 84 |
| CHERRY VALLEY RD | 76 |
| BELKNAP MOUNTAIN RD | 44 |
| OLD LAKESHORE RD | 44 |
| WEIRS RD | 30 |
| BELKNAP POINT RD | 28 |
| INTERVALE RD | 28 |
| LAKE STREET ST | 26 |
| LISCOMB CIR | 26 |
| CHERRY VALLEY ROAD | 24 |
| GILFORD AVE | 24 |
| HOYT RD | 20 |
| SARGENT PL | 18 |
| MORRILL ST | 16 |
| VARNEY POINT RD | 16 |
| BELKNAP MOUNTAIN ROAD | 14 |
| CHESTNUT DR | 14 |
| COTTON HILL RD | 14 |
| KIMBALL RD | 14 |
| LAKE SHORE RD | 14 |
| LAKESHORE ROAD | 14 |
| MOUNTAIN DR | 14 |
| SLEEPER HILL RD | 14 |
| LISCOMB CIRCLE | 12 |
| SCHOOLHOUSE HILL RD | 12 |
| WHITE BIRCH DR | 12 |
| BLUEBERRY HILL LN | 10 |
| CHERRY VALLEY RD | 10 |
| COUNTRY CLUB RD | 10 |
| DOCKHAM SHORE RD | 10 |
| Other | 108 |
2002 - 2018 National Fire Incident Reporting System (NFIRS) incidents
- Incident types reported to NFIRS in Gilford, NH
- 4,09248.7%Rescue & EMS
- 97511.6%Hazardous Condition
- 97211.6%False Alarm
- 8239.8%Good Intent Call
- 8009.5%Fire
- 7038.4%Service Call
- 140.2%Severe Weather
- 100.1%Overpressure Rupture
- Fire incident types reported to NFIRS in Gilford, NH
- 40750.9%Structure Fires
- 22728.4%Outside Fires
- 9011.3%Mobile Property/Vehicle Fires
- 769.5%Other
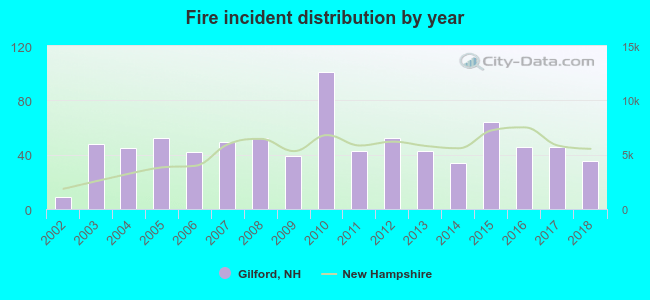 Based on the data from the years 2002 - 2018 the average number of fires per year is 47. The highest number of reported fires - 101 took place in 2010, and the least - 9 in 2002. The data has a growing trend.
The average number of yearly fire incidents per 10k residents in Gilford, NH compared to nearest cities:
(Note: Based on data for the last 3 years, including only cities with population 5,000 and above)
| Gilford: | 59.4 |
| Laconia: | 91.7 |
| Belmont: | 80.2 |
| Alton: | 78.7 |
| Franklin: | 67.6 |
| Loudon: | 96.5 |
| Wakefield: | 117.5 |
| Concord: | 41.9 |
| Pembroke: | 20.6 |
 The median response time based on all reported fire incidents is 8 minutes. This is close to the New Hampshire median value.
The median response time in Gilford, NH compared to nearest cities:
(Note: Based on data for all years, including only cities with at least 500 fire incidents)
| Gilford: | 8 minutes |
| Laconia: | 6 minutes |
| Belmont: | 9 minutes |
| Meredith: | 7 minutes |
| Alton: | 14 minutes |
| Wolfeboro: | 7 minutes |
| Sanbornton: | 12 minutes |
| Tilton: | 7 minutes |
| Northfield: | 8 minutes |
 29.0% incidents where reported in the morning and 71.0% in the evening. The most fires (15.6%) took place on Friday, and the least (12.4%) on Tuesday.
 Based on the 800 fire incidents from years 2002 - 2018 most fires (10.8%) took place during February, and the least (5.0%) in August.
 Out of all 8,394 cases reported during the years 2002 - 2018, the most belonged to the categories: Rescue & EMS (48.7%), Hazardous Condition (11.6%), and False Alarm (11.6%).
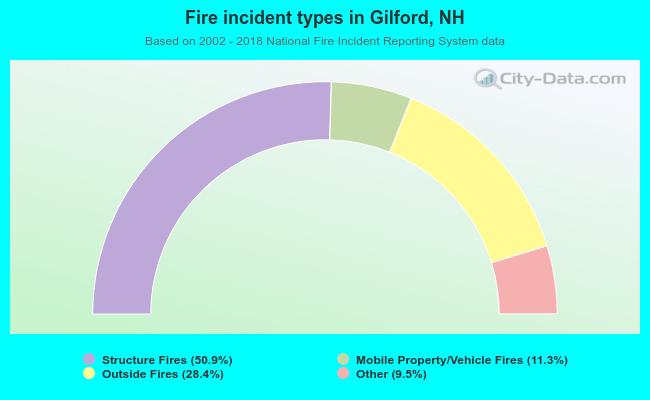 When looking into fire subcategories, the most incidents belonged to: Structure Fires (50.9%), and Outside Fires (28.4%).