Fairfield Glade: Fire Incidents, Tennessee (TN)
Where are fire incidents reported in Fairfield Glade, TN
Something went wrong! Please refresh the page.
|
| |||||||||||||||||||||||||||||||||||||||||||||||||||||||||||||||||||||||||||||||||||||||||||||||||||||||||||||
2002 - 2018 National Fire Incident Reporting System (NFIRS) incidents
- Incident types reported to NFIRS in Fairfield Glade, TN
- 57641.4%Rescue & EMS
- 23016.5%Hazardous Condition
- 22516.2%Fire
- 19714.2%False Alarm
- 1138.1%Good Intent Call
- 412.9%Service Call
- 30.2%Severe Weather
- 30.2%Special Incident
- 20.1%Overpressure Rupture
- Fire incident types reported to NFIRS in Fairfield Glade, TN
- 11852.4%Structure Fires
- 7232.0%Outside Fires
- 2310.2%Mobile Property/Vehicle Fires
- 125.3%Other
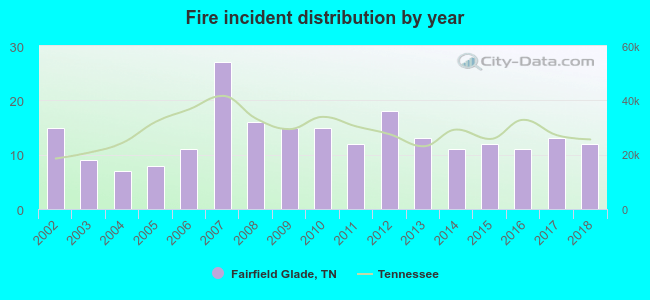 Based on the data from the years 2002 - 2018 the average number of fires per year is 13. The highest number of fire incidents - 27 took place in 2007, and the least - 7 in 2004. The data has a dropping trend.
The average number of yearly fire incidents per 10k residents in Fairfield Glade, TN compared to nearest cities:
(Note: Based on data for the last 3 years, including only cities with population 5,000 and above)
| Fairfield Glade: | 17.2 |
| Crossville: | 214.2 |
| Rockwood: | 230.3 |
| Harriman: | 267.5 |
| Kingston: | 160.5 |
| Sparta: | 260.1 |
| Oak Ridge: | 29.8 |
| Rickman: | 17.0 |
| Loudon: | 166.2 |

 33.3% incidents where reported in the morning and 66.7% in the evening. The most fires (16.0%) took place on Friday, and the least (12.9%) on Monday.
 Based on the 225 fire incidents from years 2002 - 2018 most fires (12.9%) took place during May, and the least (5.3%) in September.
 Out of all 1,390 cases reported during the years 2002 - 2018, the most belonged to the categories: Rescue & EMS (41.4%), Hazardous Condition (16.5%), and Fire (16.2%).
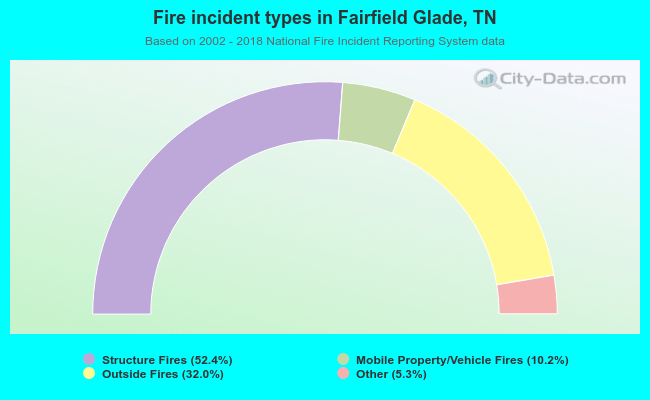 When looking into fire subcategories, the most reports belonged to: Structure Fires (52.4%), and Outside Fires (32.0%).