East Providence: Fire Incidents, Rhode Island (RI)
Where are fire incidents reported in East Providence, RI
Something went wrong! Please refresh the page.
| Fire incidents reported | |
|---|---|
| Sreet name | Count |
| TAUNTON AVE | 154 |
| PAWTUCKET AVE | 128 |
| EVERGREEN DR | 102 |
| WARREN AVE | 102 |
| NEWPORT AVE | 100 |
| WAMPANOAG TRL | 74 |
| FERRIS AVE | 68 |
| WATERMAN AVE | 66 |
| WILLETT AVE | 56 |
| BULLOCKS POINT AVE | 52 |
| NORTH BROADWAY | 42 |
| NARRAGANSETT PARK DR | 38 |
| FORBES ST | 36 |
| NEWMAN AVE | 34 |
| VETERANS MEMORIAL | 34 |
| SUTTON AVE | 32 |
| GOLDSMITH AVE | 30 |
| ROGER WILLIAMS AVE | 26 |
| BROADWAY | 24 |
| GROVE AVE | 24 |
| ROUTE 195 EAST | 24 |
| ARTHUR AVE | 22 |
| CHURCH ST | 22 |
| IVY ST | 22 |
| MAURAN AVE | 22 |
| SOUTH BROADWAY | 22 |
| BROWN ST | 20 |
| MERCER ST | 20 |
| ROUTE 195 WEST | 20 |
| VILLAGE GREEN SOUTH | 20 |
| Other | 64 |
2009 - 2018 National Fire Incident Reporting System (NFIRS) incidents
- Incident types reported to NFIRS in East Providence, RI
- 24,19066.6%Rescue & EMS
- 4,02811.1%False Alarm
- 3,61610.0%Service Call
- 1,5004.1%Fire
- 1,4934.1%Good Intent Call
- 1,4173.9%Hazardous Condition
- 590.2%Special Incident
- Fire incident types reported to NFIRS in East Providence, RI
- 72048.0%Structure Fires
- 44829.9%Outside Fires
- 16811.2%Other
- 16410.9%Mobile Property/Vehicle Fires
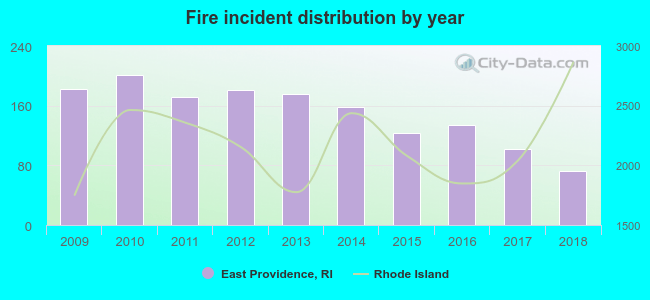 According to the data from the years 2009 - 2018 the average number of fire incidents per year is 150. The highest number of fires - 201 took place in 2010, and the least - 72 in 2018. The data has a dropping trend.
The average number of yearly fire incidents per 10k residents in East Providence, RI compared to nearest cities:
(Note: Based on data for the last 3 years, including only cities with population 5,000 and above)
| East Providence: | 21.7 |
| Providence: | 4.8 |
| Barrington: | 5.4 |
| Cranston: | 25.6 |
| Pawtucket: | 0.3 |
| Central Falls: | 96.2 |
| Warwick: | 0.3 |
| Johnston: | 26.6 |
| Lincoln: | 31.0 |
 The median response time based on all reported fire incidents is 5 minutes. This is close to the Rhode Island median value.
The median response time in East Providence, RI compared to nearest cities:
(Note: Based on data for all years, including only cities with at least 500 fire incidents)
| East Providence: | 5 minutes |
| Seekonk: | 6 minutes |
| Providence: | 5 minutes |
| Cranston: | 4 minutes |
| Rehoboth: | 6 minutes |
| Central Falls: | 2 minutes |
| North Providence: | 4 minutes |
| Warwick: | 4 minutes |
| Swansea: | 7 minutes |
 Based on the data from the years 2009 - 2018 the average number of fire-related yearly deaths is 0. The highest number of reported deaths - 1 took place in 2010, and the lowest - 0 in 2009. The data has a constant trend.
 Based on the reports from the years 2009 - 2018 the average number of fire-related casualties per year is 7. The highest number of injuries - 12 took place in 2012, and the lowest - 0 in 2017. The data has a decreasing trend.
The average number of injuries per 1,000 fire incidents is 41. This indicator was the highest - 70 in 2014, and the lowest 0 in 2017. The trend for casualties per 1,000 incidents is decreasing. Compared to the state value the number of casualties per 1,000 fire incidents is much higher.
Based on the reports from the years 2009 - 2018 the average number of fire-related casualties per year is 7. The highest number of injuries - 12 took place in 2012, and the lowest - 0 in 2017. The data has a decreasing trend.
The average number of injuries per 1,000 fire incidents is 41. This indicator was the highest - 70 in 2014, and the lowest 0 in 2017. The trend for casualties per 1,000 incidents is decreasing. Compared to the state value the number of casualties per 1,000 fire incidents is much higher.Casualties per 1,000 incidents in East Providence, RI compared to nearest cities:
(Note: Based on data for all years, including only cities with at least 500 fire incidents)
| East Providence: | 44.7 |
| Seekonk: | 11.2 |
| Providence: | 0.7 |
| Cranston: | 16.0 |
| Rehoboth: | 10.5 |
| Central Falls: | 11.8 |
| North Providence: | 10.6 |
| Warwick: | 2.8 |
| Swansea: | 9.5 |
 28.0% incidents where reported in the morning and 72.0% in the evening. The most fires (16.6%) took place on Sunday, and the least (13.4%) on Wednesday.
 According to the 1,500 fires from years 2009 - 2018 most fires (13.8%) took place during May, and the least (4.5%) in December.
 Out of all 36,322 cases reported during the years 2009 - 2018, the most belonged to the categories: Rescue & EMS (66.6%), False Alarm (11.1%), and Service Call (10.0%).
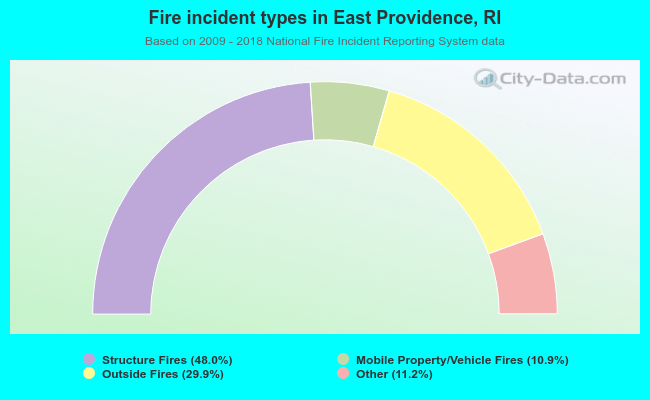 When looking into fire subcategories, the most reports belonged to: Structure Fires (48.0%), and Outside Fires (29.9%).