Deer Park: Fire Incidents, New York (NY)
Where are fire incidents reported in Deer Park, NY
Something went wrong! Please refresh the page.
|
| |||||||||||||||||||||||||||||||||||||||||||||||||||||||||||||||||||||||||||||||||||||||||||||||||||||||||||||
2003 - 2018 National Fire Incident Reporting System (NFIRS) incidents
- Incident types reported to NFIRS in Deer Park, NY
- 10,42173.6%Rescue & EMS
- 1,3389.4%False Alarm
- 1,2258.7%Good Intent Call
- 5543.9%Hazardous Condition
- 3872.7%Service Call
- 2121.5%Fire
- Fire incident types reported to NFIRS in Deer Park, NY
- 15271.7%Structure Fires
- 4420.8%Outside Fires
- 94.2%Other
- 73.3%Mobile Property/Vehicle Fires
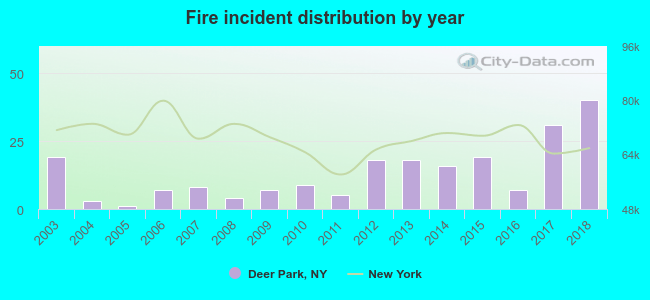 According to the data from the years 2003 - 2018 the average number of fire incidents per year is 13. The highest number of fires - 40 took place in 2018, and the least - 1 in 2005. The data has an increasing trend.
The average number of yearly fire incidents per 10k residents in Deer Park, NY compared to nearest cities:
(Note: Based on data for the last 3 years, including only cities with population 5,000 and above)
| Deer Park: | 9.4 |
| Wheatley Heights: | 6.8 |
| North Babylon: | 1.5 |
| Wyandanch: | 14.0 |
| Dix Hills: | 2.2 |
| West Babylon: | 0.2 |
| West Islip: | 11.9 |
| Melville: | 9.8 |
| Bay Shore: | 44.6 |
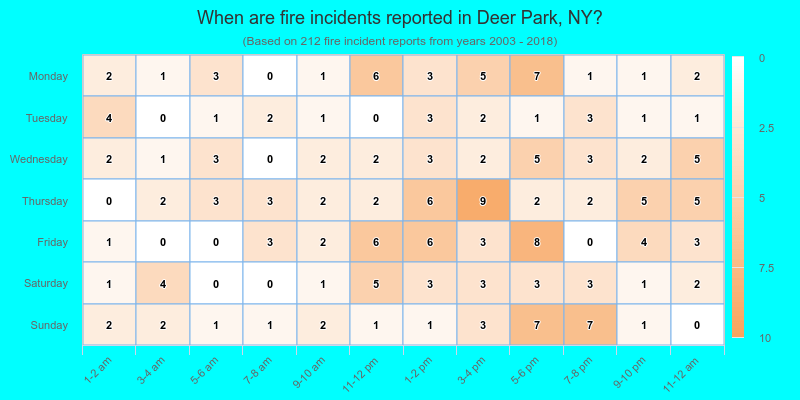
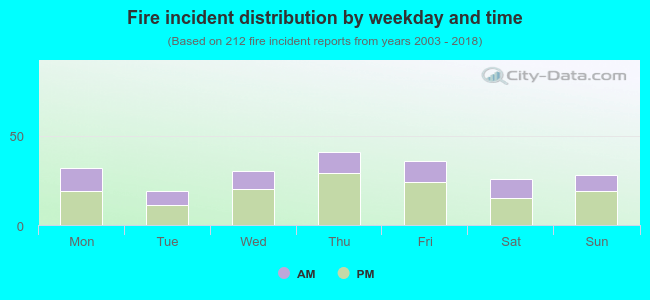 35.4% incidents where reported in the morning and 64.6% in the evening. The most fires (19.3%) took place on Thursday, and the least (9.0%) on Tuesday.
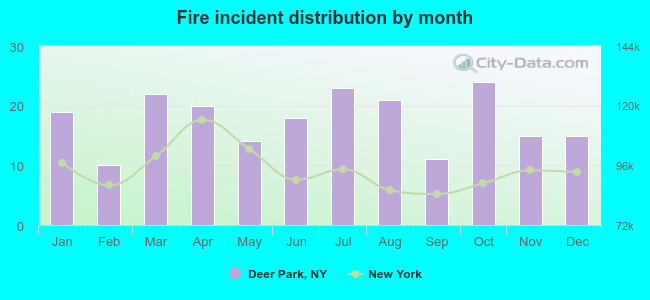 Based on the 212 reports from years 2003 - 2018 most fires (11.3%) took place during October, and the least (4.7%) in February.
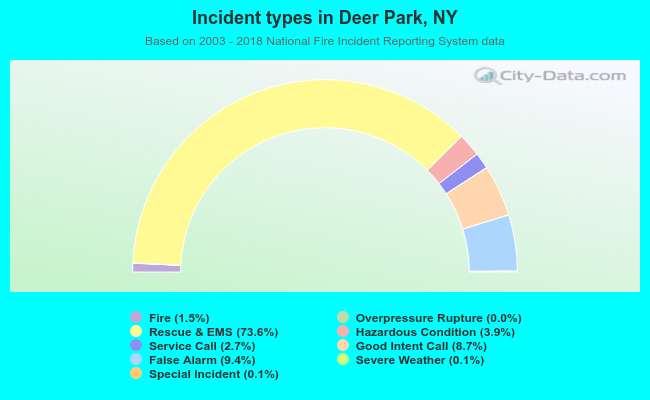 Out of all 14,161 cases reported during the years 2003 - 2018, the most belonged to the categories: Rescue & EMS (73.6%), False Alarm (9.4%), and Good Intent Call (8.7%).
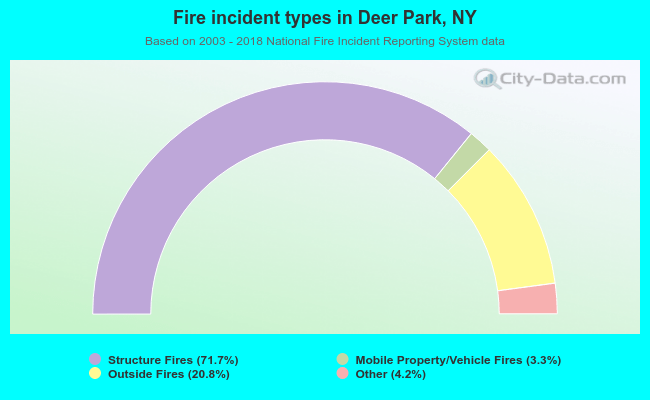 When looking into fire subcategories, the most incidents belonged to: Structure Fires (71.7%), and Outside Fires (20.8%).