De Pere: Fire Incidents, Wisconsin (WI)
Where are fire incidents reported in De Pere, WI
Something went wrong! Please refresh the page.
| Fire incidents reported | |
|---|---|
| Sreet name | Count |
| BROADWAY ST | 74 |
| MAIN AVE | 54 |
| NINTH ST | 54 |
| LAWRENCE DR | 50 |
| GRANT ST | 44 |
| SCHEURING RD | 38 |
| MATTHEW DR | 34 |
| HURON ST | 24 |
| REID ST | 24 |
| ERIE ST | 22 |
| FORT HOWARD AVE | 22 |
| LOST DAUPHIN RD | 22 |
| RIDGEWAY DR | 22 |
| ENTERPRISE DR | 20 |
| HWY 41 NB | 18 |
| MORNING GLORY LANE | 18 |
| AMERICAN BLVD | 16 |
| CHARLES ST | 16 |
| SIXTH ST | 16 |
| SUPERIOR ST | 16 |
| TENTH ST | 16 |
| THIRD ST | 16 |
| CHICAGO ST | 14 |
| COOK ST | 14 |
| DICKINSON RD | 14 |
| JAMES ST | 14 |
| PATRIOT WAY | 14 |
| ST. BERNARD DR | 14 |
| FOURTH ST | 12 |
| GOLDEN GLOW RD | 12 |
| Other | 325 |
2002 - 2018 National Fire Incident Reporting System (NFIRS) incidents
- Incident types reported to NFIRS in De Pere, WI
- 5,82362.1%Rescue & EMS
- 1,13512.1%Hazardous Condition
- 1,06911.4%Fire
- 5085.4%False Alarm
- 5035.4%Good Intent Call
- 2913.1%Service Call
- 270.3%Overpressure Rupture
- 100.1%Special Incident
- Fire incident types reported to NFIRS in De Pere, WI
- 53349.9%Structure Fires
- 26925.2%Outside Fires
- 16715.6%Mobile Property/Vehicle Fires
- 1009.4%Other
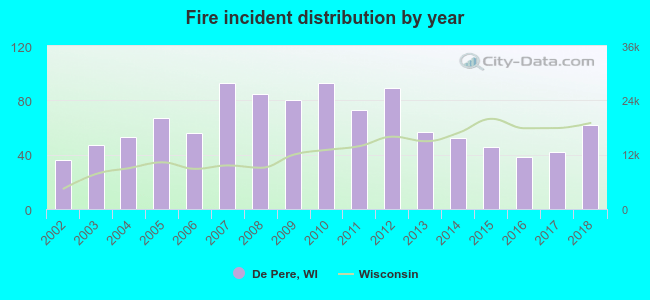 Based on the data from the years 2002 - 2018 the average number of fire incidents per year is 63. The highest number of fire incidents - 93 took place in 2007, and the least - 36 in 2002. The data has a growing trend.
The average number of yearly fire incidents per 10k residents in De Pere, WI compared to nearest cities:
(Note: Based on data for the last 3 years, including only cities with population 5,000 and above)
| De Pere: | 19.3 |
| Allouez: | 0.7 |
| Ashwaubenon: | 9.0 |
| Ledgeview: | 4.6 |
| Bellevue: | 27.8 |
| Green Bay: | 22.1 |
| Hobart: | 5.1 |
| Howard: | 11.4 |
| Freedom: | 10.3 |
 The median response time based on all reported fire incidents is 6 minutes. This is similar to the Wisconsin median value.
The median response time in De Pere, WI compared to nearest cities:
(Note: Based on data for all years, including only cities with at least 500 fire incidents)
| De Pere: | 6 minutes |
| Green Bay: | 5 minutes |
| Kaukauna: | 6 minutes |
| Pulaski: | 10 minutes |
| Appleton: | 5 minutes |
| Grand Chute: | 5 minutes |
| Menasha: | 5 minutes |
| Neenah: | 5 minutes |
 Based on the reports from the years 2002 - 2018 the average number of fire-related yearly casualties is 1. The highest number of casualties - 12 took place in 2018, and the lowest - 0 in 2003. The data has an increasing trend.
The average number of injuries per 1,000 fires is 21. This indicator was the highest - 194 in 2018, and the lowest 0 in 2003. The trend for injuries per 1,000 fire incidents is rising. Compared to the Wisconsin value the number of injuries per 1,000 fires is much higher.
Based on the reports from the years 2002 - 2018 the average number of fire-related yearly casualties is 1. The highest number of casualties - 12 took place in 2018, and the lowest - 0 in 2003. The data has an increasing trend.
The average number of injuries per 1,000 fires is 21. This indicator was the highest - 194 in 2018, and the lowest 0 in 2003. The trend for injuries per 1,000 fire incidents is rising. Compared to the Wisconsin value the number of injuries per 1,000 fires is much higher.
 32.6% incidents where reported in the morning and 67.4% in the evening. The most fires (16.1%) took place on Friday, and the least (12.7%) on Monday.
 Based on the 1,069 reports from years 2002 - 2018 most fires (11.8%) took place during May, and the least (6.2%) in January.
 Out of all 9,372 cases reported during the years 2002 - 2018, the most belonged to the categories: Rescue & EMS (62.1%), Hazardous Condition (12.1%), and Fire (11.4%).
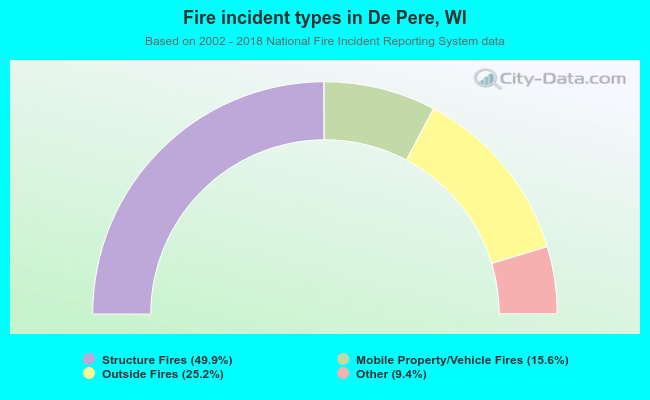 When looking into fire subcategories, the most incidents belonged to: Structure Fires (49.9%), and Outside Fires (25.2%).