Danville: Fire Incidents, Illinois (IL)
Where are fire incidents reported in Danville, IL
Something went wrong! Please refresh the page.
| Fire incidents reported | |
|---|---|
| Sreet name | Count |
| VERMILION ST | 348 |
| MAIN ST | 286 |
| GILBERT ST | 176 |
| FAIRCHILD ST | 164 |
| BOWMAN AVE | 154 |
| OAK ST | 142 |
| GRIFFIN ST | 128 |
| EDGEWOOD DR | 122 |
| HARMON AVE | 96 |
| ROBINSON ST | 88 |
| CHANDLER ST | 80 |
| BELTON AVE | 74 |
| GARDEN DR | 74 |
| SEMINARY ST | 72 |
| HAZEL ST | 70 |
| HARRISON ST | 66 |
| LOGAN AVE | 66 |
| VOORHEES ST | 66 |
| WARRINGTON AVE | 66 |
| FRANKLIN | 64 |
| GRANT ST | 64 |
| WALNUT ST | 62 |
| JACKSON ST | 58 |
| VALLEYVIEW AVE | 58 |
| SHERMAN ST | 54 |
| COLLETT ST | 48 |
| TENNESSEE AVE | 48 |
| WILLIAMS | 48 |
| WILLIAMS ST | 48 |
| COMMERCIAL ST | 46 |
| Other | 1,039 |
2002 - 2018 National Fire Incident Reporting System (NFIRS) incidents
- Incident types reported to NFIRS in Danville, IL
- 9,36442.0%Rescue & EMS
- 3,97517.8%Fire
- 3,09713.9%Hazardous Condition
- 2,1919.8%Service Call
- 2,0389.1%Good Intent Call
- 1,5196.8%False Alarm
- 1090.5%Overpressure Rupture
- Fire incident types reported to NFIRS in Danville, IL
- 1,82145.8%Structure Fires
- 1,45836.7%Outside Fires
- 54613.7%Mobile Property/Vehicle Fires
- 1503.8%Other
 Based on the data from the years 2002 - 2018 the average number of fires per year is 234. The highest number of reported fire incidents - 310 took place in 2005, and the least - 106 in 2002. The data has a rising trend.
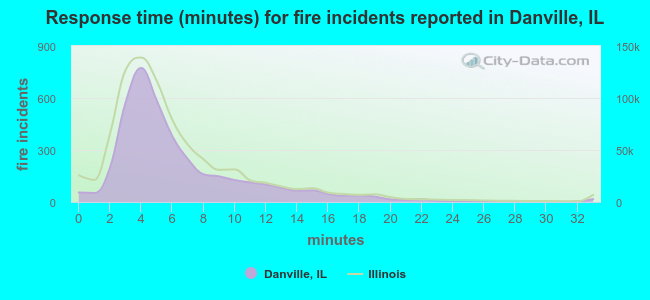 The median response time based on all reported fire incidents is 5 minutes. This is about the same as the state median value.
The median response time in Danville, IL compared to nearest cities:
(Note: Based on data for all years, including only cities with at least 500 fire incidents)
| Danville: | 5 minutes |
| Westville: | 10 minutes |
| Georgetown: | 10 minutes |
| Hoopeston: | 5 minutes |
| Rantoul: | 5 minutes |
| Urbana: | 5 minutes |
| Savoy: | 7 minutes |
| Champaign: | 5 minutes |
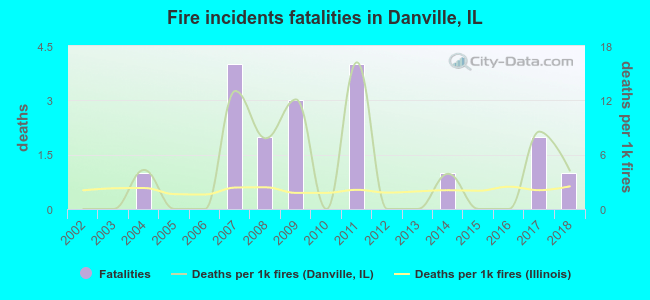 According to the data from the years 2002 - 2018 the average number of fire-related yearly deaths is 1. The highest number of deaths - 4 took place in 2007, and the lowest - 0 in 2002. The data has a rising trend.
The average number of deaths per 1,000 fires is 4. This indicator was the highest - 16 in 2011, and the lowest 0 in 2002. The trend for fatalities per 1,000 fire incidents is rising. Compared to the state value the number of deaths per 1,000 fire incidents is much higher.
According to the data from the years 2002 - 2018 the average number of fire-related yearly deaths is 1. The highest number of deaths - 4 took place in 2007, and the lowest - 0 in 2002. The data has a rising trend.
The average number of deaths per 1,000 fires is 4. This indicator was the highest - 16 in 2011, and the lowest 0 in 2002. The trend for fatalities per 1,000 fire incidents is rising. Compared to the state value the number of deaths per 1,000 fire incidents is much higher.
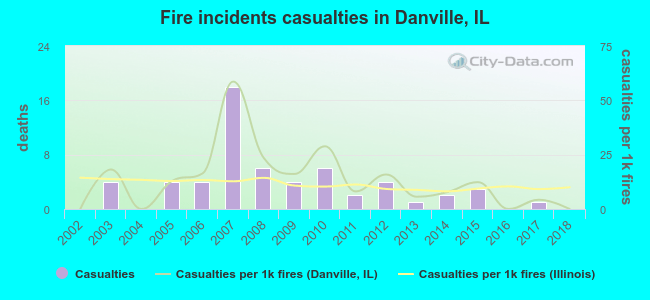 According to the data from the years 2002 - 2018 the average number of fire-related yearly casualties is 3. The highest number of reported injuries - 18 took place in 2007, and the lowest - 0 in 2002. The data has a constant trend.
The average number of casualties per 1,000 fires is 13. This indicator was the highest - 59 in 2007, and the lowest 0 in 2002. The trend for injuries per 1,000 incidents is constant. Compared to the state value the number of casualties per 1,000 incidents is higher.
According to the data from the years 2002 - 2018 the average number of fire-related yearly casualties is 3. The highest number of reported injuries - 18 took place in 2007, and the lowest - 0 in 2002. The data has a constant trend.
The average number of casualties per 1,000 fires is 13. This indicator was the highest - 59 in 2007, and the lowest 0 in 2002. The trend for injuries per 1,000 incidents is constant. Compared to the state value the number of casualties per 1,000 incidents is higher.
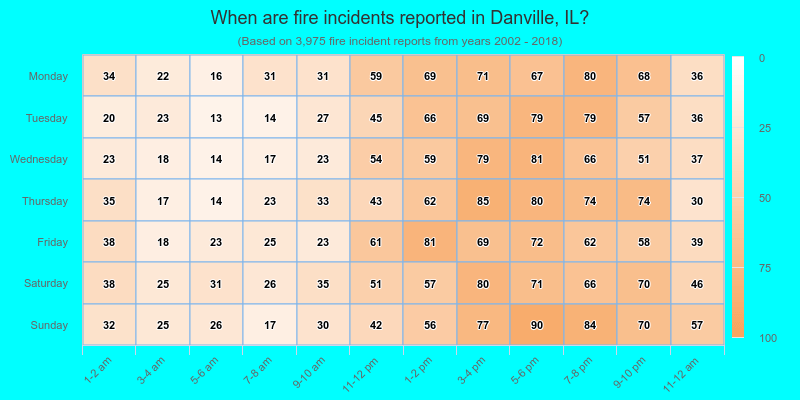
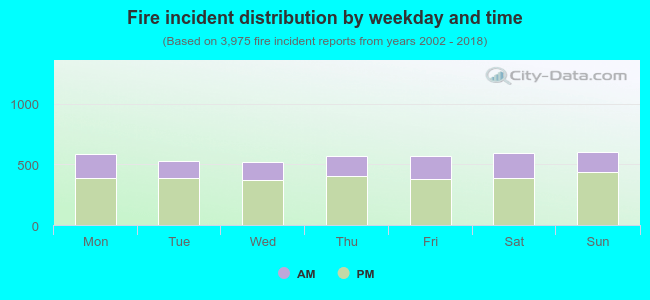 30.6% incidents where reported in the morning and 69.4% in the evening. The most fires (15.2%) took place on Sunday, and the least (13.1%) on Wednesday.
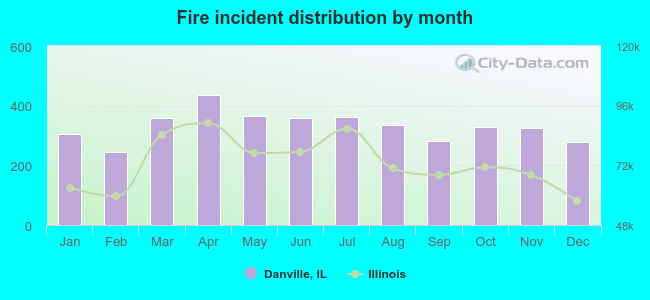 Based on the 3,975 fire incidents from years 2002 - 2018 most fires (11.0%) took place during April, and the least (6.1%) in February.
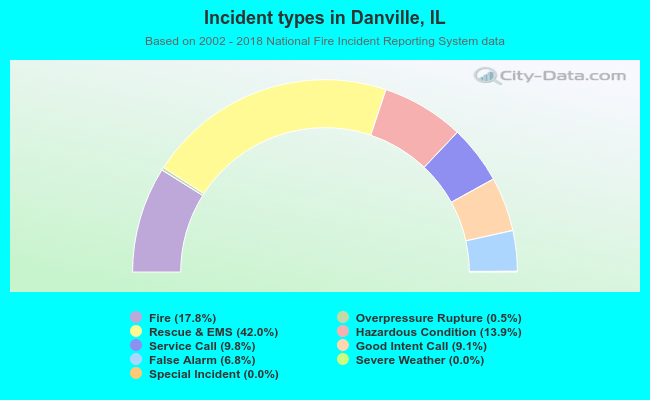 Out of all 22,312 cases reported during the years 2002 - 2018, the most belonged to the categories: Rescue & EMS (42.0%), Fire (17.8%), and Hazardous Condition (13.9%).
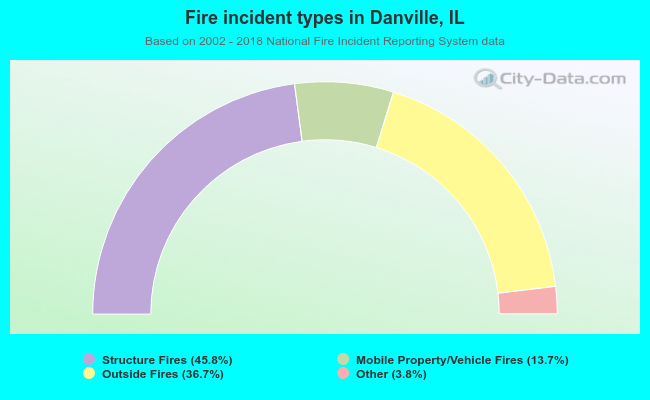 When looking into fire subcategories, the most incidents belonged to: Structure Fires (45.8%), and Outside Fires (36.7%).