Champlin: Fire Incidents, Minnesota (MN)
Where are fire incidents reported in Champlin, MN
Something went wrong! Please refresh the page.
|
| |||||||||||||||||||||||||||||||||||||||||||||||||||||||||||||||||||||||||||||||||||||||||||||||||||||||||||||
2002 - 2018 National Fire Incident Reporting System (NFIRS) incidents
- Incident types reported to NFIRS in Champlin, MN
- 79134.5%Hazardous Condition
- 51322.4%Fire
- 35015.3%False Alarm
- 30713.4%Good Intent Call
- 2189.5%Service Call
- 1114.8%Rescue & EMS
- 30.1%Severe Weather
- Fire incident types reported to NFIRS in Champlin, MN
- 24247.2%Structure Fires
- 15630.4%Outside Fires
- 10119.7%Mobile Property/Vehicle Fires
- 142.7%Other
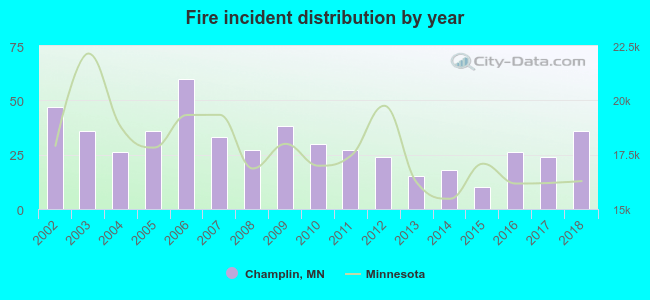 Based on the data from the years 2002 - 2018 the average number of fires per year is 30. The highest number of fire incidents - 60 took place in 2006, and the least - 10 in 2015. The data has a dropping trend.
The average number of yearly fire incidents per 10k residents in Champlin, MN compared to nearest cities:
(Note: Based on data for the last 3 years, including only cities with population 5,000 and above)
| Champlin: | 12.0 |
| Anoka: | 32.2 |
| Coon Rapids: | 20.4 |
| Brooklyn Park: | 30.2 |
| Maple Grove: | 9.9 |
| Andover: | 14.2 |
| Ramsey: | 15.8 |
| Spring Lake Park: | 22.7 |
| Blaine: | 16.9 |
 The median response time based on all reported fire incidents is 9 minutes. This is higher compared to the state median value.
The median response time in Champlin, MN compared to nearest cities:
(Note: Based on data for all years, including only cities with at least 500 fire incidents)
| Champlin: | 9 minutes |
| Anoka: | 6 minutes |
| Coon Rapids: | 5 minutes |
| Brooklyn Park: | 5 minutes |
| Maple Grove: | 7 minutes |
| Andover: | 8 minutes |
| Ramsey: | 7 minutes |
| Blaine: | 7 minutes |
| Brooklyn Center: | 6 minutes |
 25.7% incidents where reported in the morning and 74.3% in the evening. The most fires (16.2%) took place on Monday, and the least (13.3%) on Friday.
 Based on the 513 fires from years 2002 - 2018 most fires (12.7%) took place during July, and the least (5.1%) in February.
 Out of all 2,293 cases reported during the years 2002 - 2018, the most belonged to the categories: Rescue & EMS (34.5%), Fire (22.4%), and Good Intent Call (15.3%).
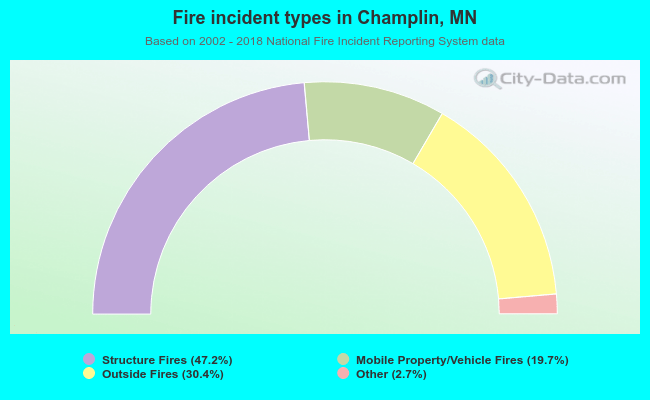 When looking into fire subcategories, the most reports belonged to: Structure Fires (47.2%), and Outside Fires (30.4%).