Caledonia: Fire Incidents, Wisconsin (WI)
Where are fire incidents reported in Caledonia, WI
Something went wrong! Please refresh the page.
|
| |||||||||||||||||||||||||||||||||||||||||||||||||||||||||||||||||||||||||||||||||||||||||||||||||||||||||||||
2002 - 2018 National Fire Incident Reporting System (NFIRS) incidents
- Incident types reported to NFIRS in Caledonia, WI
- 63350.0%Rescue & EMS
- 26420.8%Fire
- 15312.1%Hazardous Condition
- 876.9%Good Intent Call
- 725.7%False Alarm
- 524.1%Service Call
- 40.3%Special Incident
- 20.2%Overpressure Rupture
- Fire incident types reported to NFIRS in Caledonia, WI
- 9636.4%Outside Fires
- 8733.0%Structure Fires
- 6926.1%Mobile Property/Vehicle Fires
- 124.5%Other
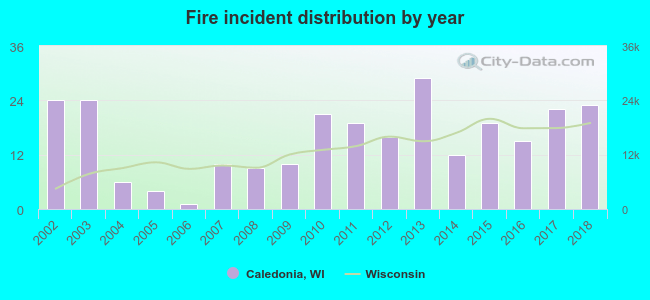 Based on the data from the years 2002 - 2018 the average number of fire incidents per year is 16. The highest number of reported fire incidents - 29 took place in 2013, and the least - 1 in 2006. The data has a dropping trend.
The average number of yearly fire incidents per 10k residents in Caledonia, WI compared to nearest cities:
(Note: Based on data for the last 3 years, including only cities with population 5,000 and above)
| Caledonia: | 8.1 |
| Racine: | 33.7 |
| Mount Pleasant: | 8.9 |
| Oak Creek: | 30.0 |
| Sturtevant: | 43.0 |
| South Milwaukee: | 23.5 |
| Franklin: | 22.7 |
| Cudahy: | 31.1 |
| Somers: | 39.9 |

 30.7% incidents where reported in the morning and 69.3% in the evening. The most fires (15.9%) took place on Friday, and the least (12.9%) on Thursday.
 According to the 264 fire incident reports from years 2002 - 2018 most fires (13.6%) took place during March, and the least (4.5%) in September.
 Out of all 1,267 cases reported during the years 2002 - 2018, the most belonged to the categories: Rescue & EMS (50.0%), Fire (20.8%), and Hazardous Condition (12.1%).
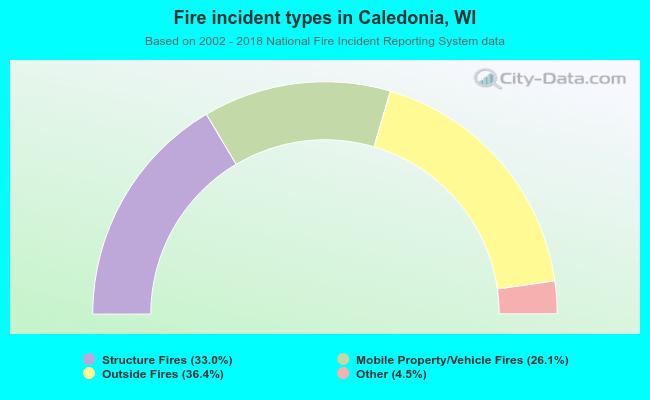 When looking into fire subcategories, the most incidents belonged to: Outside Fires (36.4%), and Structure Fires (33.0%).