Bridgewater: Fire Incidents, Massachusetts (MA)
Where are fire incidents reported in Bridgewater, MA
Something went wrong! Please refresh the page.
| Fire incidents reported | |
|---|---|
| Sreet name | Count |
| MEADOW LN | 142 |
| MAIN ST | 130 |
| PLEASANT ST | 122 |
| BROAD ST | 120 |
| BEDFORD ST | 118 |
| BURRILL AVE | 98 |
| PLYMOUTH ST | 84 |
| ROUTE 24 SOUTH | 80 |
| SOUTH ST | 80 |
| ROUTE 24 NORTH | 70 |
| BROAD ST | 66 |
| MEADOW LN | 56 |
| MAIN ST | 54 |
| SUMMER ST | 50 |
| ADMINISTRATION RD | 46 |
| HIGH ST | 46 |
| BEDFORD ST | 42 |
| ADMINISTRATION RD | 38 |
| ELM ST | 36 |
| PLEASANT ST | 36 |
| SPRING ST | 36 |
| CENTRAL SQ | 32 |
| CENTRAL SQ | 30 |
| CENTER ST | 28 |
| BURRILL AV | 26 |
| CROSS ST | 26 |
| OAK ST | 24 |
| SCHOOL ST | 24 |
| HERITAGE CIR | 22 |
| NORTH ST | 22 |
2003 - 2018 National Fire Incident Reporting System (NFIRS) incidents
- Incident types reported to NFIRS in Bridgewater, MA
- 10,53652.7%Rescue & EMS
- 2,54912.7%Hazardous Condition
- 2,38311.9%False Alarm
- 1,7418.7%Fire
- 1,5727.9%Service Call
- 9484.7%Good Intent Call
- 2101.1%Special Incident
- 320.2%Overpressure Rupture
- 230.1%Severe Weather
- Fire incident types reported to NFIRS in Bridgewater, MA
- 65137.4%Structure Fires
- 46326.6%Outside Fires
- 40823.4%Other
- 21912.6%Mobile Property/Vehicle Fires
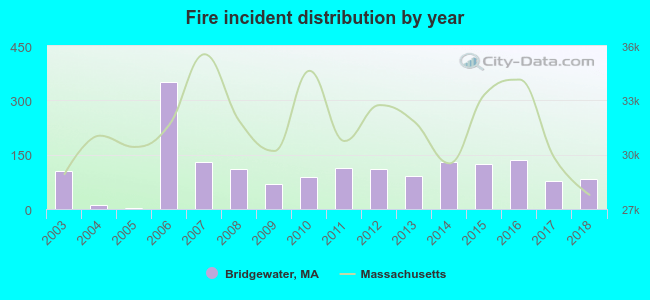 Based on the data from the years 2003 - 2018 the average number of fire incidents per year is 109. The highest number of fire incidents - 351 took place in 2006, and the least - 4 in 2005. The data has a declining trend.
The average number of yearly fire incidents per 10k residents in Bridgewater, MA compared to nearest cities:
(Note: Based on data for the last 3 years, including only cities with population 5,000 and above)
| Bridgewater: | 125.4 |
| East Bridgewater: | 25.9 |
| West Bridgewater: | 57.4 |
| Raynham: | 53.8 |
| Halifax: | 35.5 |
| Whitman: | 19.8 |
| Brockton: | 60.2 |
| Easton: | 23.4 |
| Middleborough: | 34.8 |
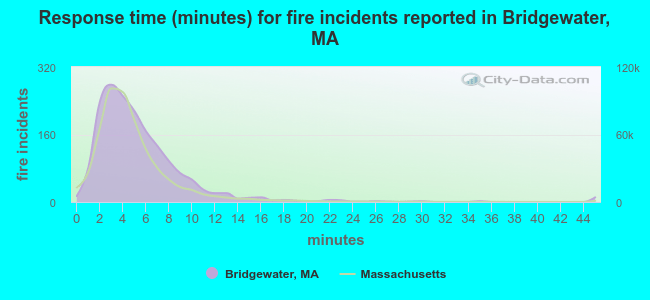 The median response time based on all reported fire incidents is 5 minutes. This is higher than the state median value.
The median response time in Bridgewater, MA compared to nearest cities:
(Note: Based on data for all years, including only cities with at least 500 fire incidents)
| Bridgewater: | 5 minutes |
| East Bridgewater: | 5 minutes |
| West Bridgewater: | 4 minutes |
| Raynham: | 4 minutes |
| Whitman: | 2 minutes |
| Brockton: | 4 minutes |
| Easton: | 5 minutes |
| Middleborough: | 5 minutes |
| Hanson: | 5 minutes |
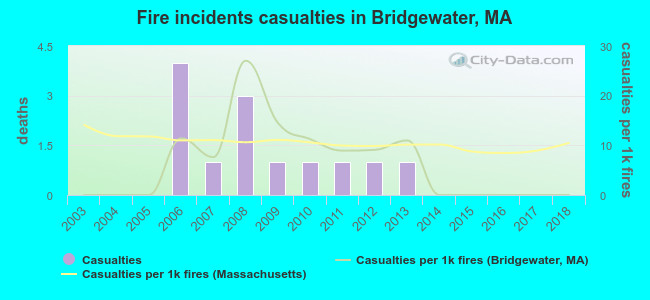 According to the data from the years 2003 - 2018 the average number of fire-related yearly casualties is 1. The highest number of reported injuries - 4 took place in 2006, and the lowest - 0 in 2003. The data has a constant trend.
The average number of injuries per 1,000 fire incidents is 6. This indicator was the highest - 27 in 2008, and the lowest 0 in 2003. The trend for injuries per 1,000 fires is constant. Compared to the state value the number of casualties per 1,000 fire incidents is lower.
According to the data from the years 2003 - 2018 the average number of fire-related yearly casualties is 1. The highest number of reported injuries - 4 took place in 2006, and the lowest - 0 in 2003. The data has a constant trend.
The average number of injuries per 1,000 fire incidents is 6. This indicator was the highest - 27 in 2008, and the lowest 0 in 2003. The trend for injuries per 1,000 fires is constant. Compared to the state value the number of casualties per 1,000 fire incidents is lower.Casualties per 1,000 incidents in Bridgewater, MA compared to nearest cities:
(Note: Based on data for all years, including only cities with at least 500 fire incidents)
| Bridgewater: | 7.5 |
| East Bridgewater: | 17.7 |
| West Bridgewater: | 10.4 |
| Raynham: | 2.1 |
| Whitman: | 24.0 |
| Brockton: | 35.0 |
| Easton: | 49.1 |
| Middleborough: | 7.5 |
| Hanson: | 4.0 |
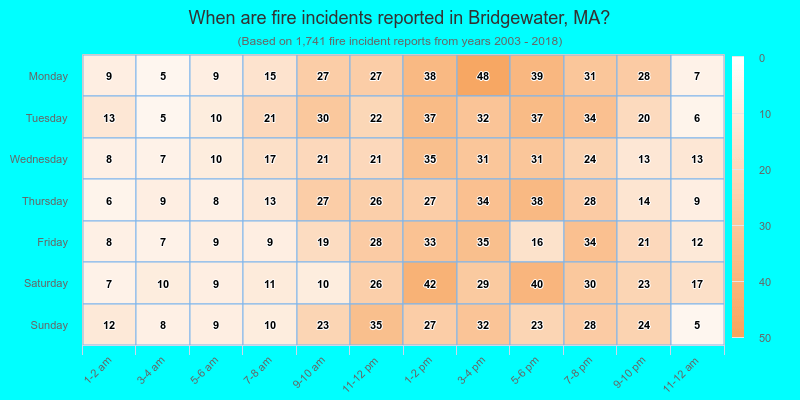
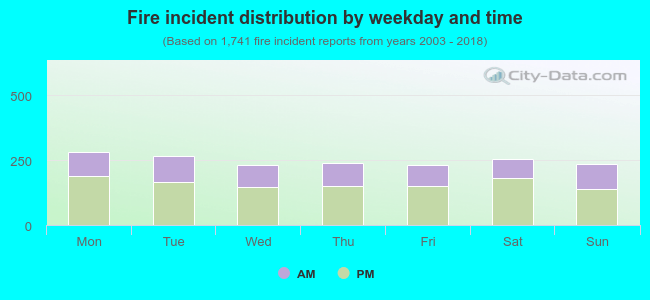 35.4% incidents where reported in the morning and 64.6% in the evening. The most fires (16.3%) took place on Monday, and the least (13.3%) on Wednesday.
 Based on the 1,741 fire incidents from years 2003 - 2018 most fires (13.4%) took place during April, and the least (4.8%) in December.
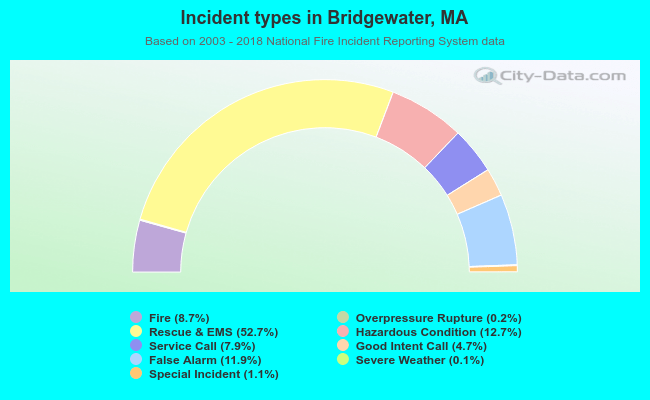 Out of all 19,994 cases reported during the years 2003 - 2018, the most belonged to the categories: Rescue & EMS (52.7%), Hazardous Condition (12.7%), and False Alarm (11.9%).
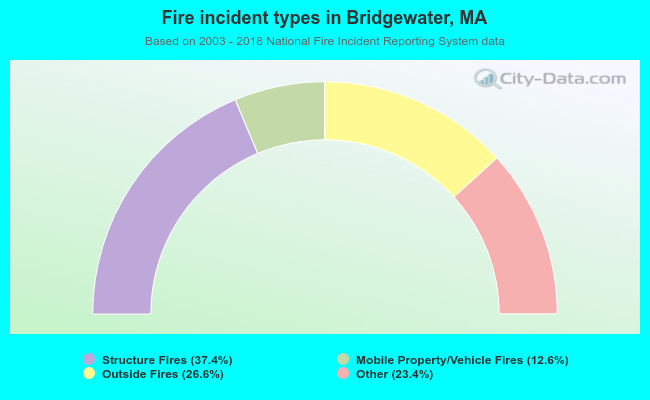 When looking into fire subcategories, the most incidents belonged to: Structure Fires (37.4%), and Outside Fires (26.6%).