Boulder City: Fire Incidents, Nevada (NV)
Where are fire incidents reported in Boulder City, NV
Something went wrong! Please refresh the page.
|
| |||||||||||||||||||||||||||||||||||||||||||||||||||||||||||||||||||||||||||||||||||||||||||||||||||||||||||||
2002 - 2018 National Fire Incident Reporting System (NFIRS) incidents
- Incident types reported to NFIRS in Boulder City, NV
- 7,19977.6%Rescue & EMS
- 6807.3%False Alarm
- 5606.0%Fire
- 4324.7%Hazardous Condition
- 2913.1%Service Call
- 850.9%Good Intent Call
- 270.3%Special Incident
- Fire incident types reported to NFIRS in Boulder City, NV
- 20135.9%Outside Fires
- 16930.2%Mobile Property/Vehicle Fires
- 11821.1%Structure Fires
- 7212.9%Other
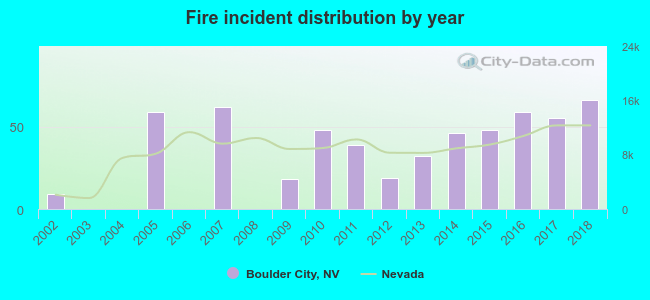 Based on the data from the years 2002 - 2018 the average number of fires per year is 33. The highest number of reported fires - 66 took place in 2018, and the least - 0 in 2003. The data has an increasing trend.
The average number of yearly fire incidents per 10k residents in Boulder City, NV compared to nearest cities:
(Note: Based on data for the last 3 years, including only cities with population 5,000 and above)
| Boulder City: | 39.0 |
| Henderson: | 21.9 |
| Clark: | 0.3 |
| Paradise: | 0.1 |
| North Las Vegas: | 41.9 |
| Las Vegas: | 98.2 |
| Laughlin: | 53.3 |
| Pahrump: | 55.1 |
| Crystal: | 1.6 |
 The median response time based on all reported fire incidents is 6 minutes. This is comparable to the state median value.
The median response time in Boulder City, NV compared to nearest cities:
(Note: Based on data for all years, including only cities with at least 500 fire incidents)
| Boulder City: | 6 minutes |
| Henderson: | 7 minutes |
| North Las Vegas: | 6 minutes |
| Las Vegas: | 6 minutes |
| Laughlin: | 6 minutes |
| Bullhead City: | 5 minutes |
| Golden Valley: | 10 minutes |
| Pahrump: | 7 minutes |
| Kingman: | 5 minutes |
 33.2% incidents where reported in the morning and 66.8% in the evening. The most fires (16.4%) took place on Saturday, and the least (12.9%) on Monday.
 According to the 560 reports from years 2002 - 2018 most fires (14.1%) took place during July, and the least (5.0%) in January.
 Out of all 9,280 cases reported during the years 2002 - 2018, the most belonged to the categories: Rescue & EMS (77.6%), False Alarm (7.3%), and Fire (6.0%).
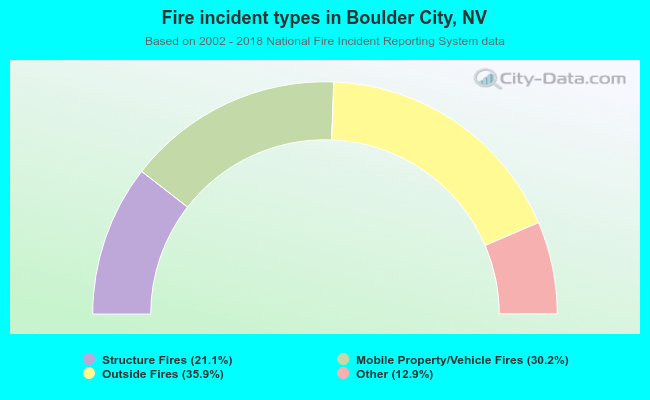 When looking into fire subcategories, the most incidents belonged to: Outside Fires (35.9%), and Mobile Property/Vehicle Fires (30.2%).