Austin: Fire Incidents, Texas (TX)
Where are fire incidents reported in Austin, TX
Something went wrong! Please refresh the page.
| Fire incidents reported | |
|---|---|
| Sreet name | Count |
| LAMAR BLVD | 1,676 |
| CONGRESS AVE | 886 |
| WILLIAM CANNON DR | 786 |
| RIVERSIDE DR | 780 |
| I 35 HWY | 690 |
| RESEARCH BLVD | 630 |
| MANCHACA RD | 588 |
| CAPITAL OF TEXAS HWY | 562 |
| 1ST ST | 546 |
| AIRPORT BLVD | 526 |
| OLTORF ST | 502 |
| I 35 | 476 |
| SLAUGHTER LN | 468 |
| BURNET RD | 466 |
| 6TH ST | 444 |
| PARMER LN | 436 |
| I 35 NB SVRD | 434 |
| I 35 SB SVRD | 434 |
| GUADALUPE ST | 414 |
| PLEASANT VALLEY RD | 402 |
| BEN WHITE BLVD | 382 |
| RUTLAND DR | 378 |
| STASSNEY LN | 376 |
| CAMERON RD | 360 |
| RUNDBERG LN | 356 |
| METRIC BLVD | 348 |
| SPRINGDALE RD | 340 |
| CESAR CHAVEZ ST | 336 |
| STATE HWY 71 | 336 |
| MANOR RD | 330 |
| Other | 23,798 |
2002 - 2018 National Fire Incident Reporting System (NFIRS) incidents
- Incident types reported to NFIRS in Austin, TX
- 228,92250.3%Rescue & EMS
- 61,63213.5%Hazardous Condition
- 58,10912.8%Good Intent Call
- 39,4868.7%Fire
- 34,1997.5%False Alarm
- 31,1706.8%Service Call
- 9230.2%Special Incident
- 8090.2%Overpressure Rupture
- Fire incident types reported to NFIRS in Austin, TX
- 20,18351.1%Outside Fires
- 10,68227.1%Structure Fires
- 7,14518.1%Mobile Property/Vehicle Fires
- 1,4763.7%Other
 Based on the data from the years 2002 - 2018 the average number of fire incidents per year is 2,323. The highest number of fire incidents - 3,415 took place in 2011, and the least - 555 in 2017. The data has a rising trend.
The average number of yearly fire incidents per 10k residents in Austin, TX compared to nearest cities:
(Note: Based on data for the last 3 years, including only cities with population 5,000 and above)
| Austin: | 17.6 |
| Jollyville: | 0.6 |
| Manor: | 38.5 |
| Bee Cave: | 21.8 |
| Pflugerville: | 20.1 |
| Lakeway: | 27.3 |
| Cedar Park: | 18.8 |
| Round Rock: | 17.3 |
| Buda: | 87.3 |
 The median response time based on all reported fire incidents is 5 minutes. This is lower than the state median value.
The median response time in Austin, TX compared to nearest cities:
(Note: Based on data for all years, including only cities with at least 500 fire incidents)
| Austin: | 5 minutes |
| Manor: | 8 minutes |
| Pflugerville: | 7 minutes |
| Cedar Park: | 6 minutes |
| Round Rock: | 5 minutes |
| Buda: | 6 minutes |
| Leander: | 7 minutes |
| Hutto: | 8 minutes |
| Dripping Springs: | 9 minutes |
 According to the data from the years 2002 - 2018 the average number of fire-related yearly deaths is 4. The highest number of reported deaths - 9 took place in 2015, and the lowest - 0 in 2011. The data has a growing trend.
The average number of fatalities per 1,000 fires is 2. This indicator was the highest - 5 in 2015, and the lowest 0 in 2011. The trend for deaths per 1,000 fires is increasing. Compared to the state value the number of deaths per 1,000 incidents is about the same.
According to the data from the years 2002 - 2018 the average number of fire-related yearly deaths is 4. The highest number of reported deaths - 9 took place in 2015, and the lowest - 0 in 2011. The data has a growing trend.
The average number of fatalities per 1,000 fires is 2. This indicator was the highest - 5 in 2015, and the lowest 0 in 2011. The trend for deaths per 1,000 fires is increasing. Compared to the state value the number of deaths per 1,000 incidents is about the same.Deaths per 1,000 incidents in Austin, TX compared to nearest cities:
(Note: Based on data for all years, including only cities with at least 2,500 fire incidents)
| Austin: | 1.8 |
| Round Rock: | 0.7 |
| Georgetown: | 1.2 |
| San Marcos: | 1.1 |
 Based on the reports from the years 2002 - 2018 the average number of fire-related casualties per year is 35. The highest number of casualties - 56 took place in 2010, and the lowest - 3 in 2017. The data has a growing trend.
The average number of casualties per 1,000 fire incidents is 15. This indicator was the highest - 23 in 2004, and the lowest 5 in 2017. The trend for casualties per 1,000 fires is rising. Compared to the state value the number of injuries per 1,000 fires is higher.
Based on the reports from the years 2002 - 2018 the average number of fire-related casualties per year is 35. The highest number of casualties - 56 took place in 2010, and the lowest - 3 in 2017. The data has a growing trend.
The average number of casualties per 1,000 fire incidents is 15. This indicator was the highest - 23 in 2004, and the lowest 5 in 2017. The trend for casualties per 1,000 fires is rising. Compared to the state value the number of injuries per 1,000 fires is higher.Casualties per 1,000 incidents in Austin, TX compared to nearest cities:
(Note: Based on data for all years, including only cities with at least 500 fire incidents)
| Austin: | 15.1 |
| Manor: | 2.5 |
| Pflugerville: | 2.1 |
| Cedar Park: | 5.9 |
| Round Rock: | 8.6 |
| Buda: | 1.6 |
| Leander: | 4.2 |
| Hutto: | 3.5 |
| Dripping Springs: | 6.2 |
 30.4% incidents where reported in the morning and 69.6% in the evening. The most fires (15.3%) took place on Saturday, and the least (13.3%) on Wednesday.
 Based on the 39,486 reports from years 2002 - 2018 most fires (10.2%) took place during January, and the least (7.0%) in October.
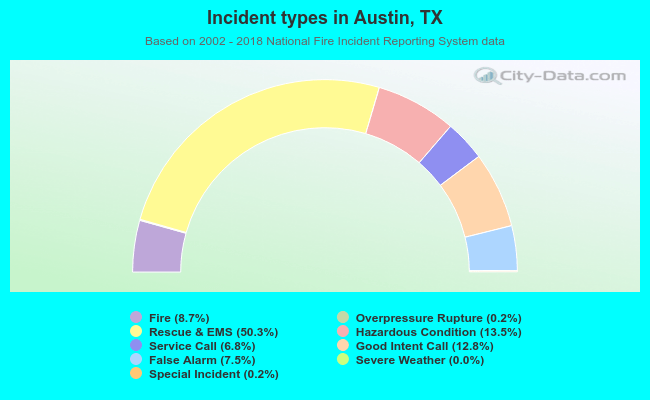 Out of all 455,409 cases reported during the years 2002 - 2018, the most belonged to the categories: Rescue & EMS (50.3%), Hazardous Condition (13.5%), and Good Intent Call (12.8%).
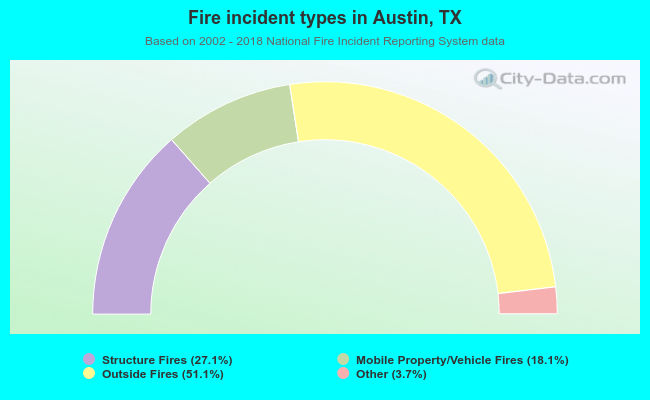 When looking into fire subcategories, the most incidents belonged to: Outside Fires (51.1%), and Structure Fires (27.1%).